Consumer Insights
Uncover trends and behaviors shaping consumer choices today
Procurement Insights
Optimize your sourcing strategy with key market data
Industry Stats
Stay ahead with the latest trends and market analysis.
The Australia food preservatives market covers substances added to food and beverages to slow spoilage, prevent mould and bacterial growth, and protect colour and flavour. Main groups include sorbates, benzoates, propionates, nitrites, sulphites and natural options such as vinegar, cultured dextrose and rosemary extract. They are supplied to food manufacturers, bakeries, meat processors and beverage makers.
In 2025, the market is valued at AUD 168.00 million in 2025 and is forecast to grow at a (CAGR) of 4.80%, reaching AUD 268.49 million by 2035. Demand rests on a large domestic food manufacturing base, long distribution distances, a strong export push, rising interest in clean label products and a permissions framework set by Food Standards Australia New Zealand under the Food Standards Code.
Compound Annual Growth Rate
4.8%
Value in AUD million
2026-2035
The Australia food preservatives market is shaped by shelf life as much as by safety. Australian food makers ship across long distances to supermarkets and export ports, so preservation choices affect waste, cost and brand trust.
Three forces shape the outlook: a shift from synthetic to natural and cultured preservation, strict permission and enforcement under the Food Standards Code, and cost pressure that pushes manufacturers towards longer shelf life and lower waste.
In September 2025, FSANZ gazetted chitosan from mushrooms as a food additive. In February 2026, PrimeSafe prosecuted a Melbourne butcher over sulphur dioxide in mince, and in September 2026 the food industry body reported sector turnover of AUD 182.6 billion.
Growth is shifting from low-cost synthetic preservatives towards natural, cultured and fermentation-derived systems, as manufacturers respond to clean label demand and labelling scrutiny. Sorbates and benzoates remain the largest type, with natural preservatives advancing fastest. Meat, poultry and seafood holds the largest application share, while ready meals, sauces and dressings grow quickest as convenience eating expands. Granules and pearls gain ground over powders because they are easier to handle and dose. New South Wales leads by size, and Queensland grows quickest. Tighter enforcement, new additive permissions and waste reduction goals underpin a steady mid-single-digit outlook.
| Metric | Value |
| Market Size 2025 | AUD 168.00 million |
| Projected Market Size 2035 | AUD 268.49 million |
| CAGR 2026 to 2035 | 4.80% |
| Fastest-Growing Preservative Type | Natural Preservatives: 7.4% CAGR |
| Fastest-Growing Application | Ready Meals, Sauces and Dressings: 6.3% CAGR |
| Largest Revenue Segment 2025 | Sorbates and Benzoates |
| Dominant Region | New South Wales |
| Highest CAGR by Region | Queensland: 5.6% |
| Food and grocery manufacturing turnover, September 2026 report | AUD 182.6 billion |
Natural Systems Outpace Synthetics
Revenue is on course to expand by about 60% across the decade, from AUD 168.00 million in 2025 to AUD 268.49 million in 2035 at a 4.8% CAGR. Clean label demand, new additive permissions and waste reduction keep purchasing repeat-driven.
Convenience Foods and Pearls Lead
Ready meals, sauces and dressings grow at an estimated 6.3% CAGR and granules and pearls at an estimated 6.0% CAGR through 2035. Easier dosing and longer chilled shelf life draw manufacturers to newer formats.
Compliance Becomes a Selling Point
Enforcement and permission changes make regulatory knowledge part of the supplier offer. Distributors and ingredient houses with technical support help food makers reformulate without breaching the Food Standards Code.
| Report Summary | Unit | Value |
| Base Year | AUD million | 2025 |
| Historical Period | AUD million | 2019 to 2025 |
| Forecast Period | AUD million | 2026 to 2035 |
| Market Size 2025 | AUD million | 168.00 |
| Market Size 2035 | AUD million | 268.49 |
| CAGR 2026 to 2035 | Percentage | 4.80 % |
| CAGR by Preservative Type: Natural Preservatives | Percentage | 7.4 % |
| CAGR by Application: Ready Meals, Sauces and Dressings | Percentage | 6.3 % |
| CAGR by Form: Granules and Pearls | Percentage | 6.0 % |
| CAGR by Region: Queensland | Percentage | 5.6 % |
| Food and Grocery Manufacturing Turnover, September 2026 Report | AUD Billion | 182.6 |
| Brenntag Reported Group Sales for 2025 | EUR Billion | 15.2 |
| Market Share by Region 2025 | New South Wales | Dominant Share |
Long supply chains, clean label demand and a permissions framework that is slowly widening support steady value growth. Synthetic types lead today, while natural systems gain ground each year.
The Australia food preservatives market is being reshaped by industry scale, cost pressure on food makers, labelling reform and active enforcement of additive rules.
September 2026 - Industry Body Reports Record Sector Scale
August 2026 - Food Makers Report Mixed Full Year Results
July 2026 - FSANZ Proposes One Annual Labelling Date
February 2026 - PrimeSafe Pursues Sulphur Dioxide in Mince
Industry scale, margin pressure and regulatory attention pull in the same direction. Manufacturers seek longer shelf life at lower waste, while regulators reward careful, compliant use of permitted additives.
Recent developments, presented from the most recent, show the Australia food preservatives market moving through new regulatory approvals, supplier earnings and a push towards clean label preservation.
August 2026 - FSANZ Approves Chitosan as a Processing Aid for Alcoholic Beverages
July 2026 - Corbion Reports First Half Results
July 2026 - Kerry Showcases Clean Label Preservation at IFT FIRST
September 2025 - FSANZ Gazettes Mushroom Chitosan as a Food Additive
Recent events show regulators opening doors to plant-derived inputs while suppliers report mixed margins. Clean label preservation and technical support are now central to supplier pitches.
The Expert Market Research’s report on the Australia Food Preservatives Market offers a detailed analysis of the market based on the following segments.
Market Breakup by Preservative Type
Sorbates and Benzoates lead revenue because beverages, sauces and dressings depend on proven, low-cost antimicrobial action. Propionates and Acetates protect bread and baked goods against mould and rope. Nitrites and Sulphites face scrutiny, shown by the PrimeSafe sulphur dioxide case in February 2026. Natural Preservatives grow fastest at an estimated 7.4% CAGR, helped by FSANZ gazetting mushroom chitosan in September 2025 and Kerry's clean label preservation push in July 2026. Others covers natamycin, nisin, lactates and antioxidant blends.
Market Breakup by Application
Meat, Poultry and Seafood leads, with processors such as Inghams reporting FY26 revenue of AUD 3,227.4 million in August 2026 and facing strict additive rules. Bakery and Confectionery depends on mould control for fresh bread and cakes. Beverages use benzoates and sorbates, and FSANZ approved a chitosan processing aid for alcoholic beverages in August 2026. Dairy and Frozen Desserts are served by Bega Group, whose FY26 revenue rose 6.7%. Ready Meals, Sauces and Dressings grow fastest at an estimated 6.3% CAGR. Others covers snacks, fruit products and pet food.
Market Breakup by Form
Powders lead because they blend easily into dry mixes, flour and seasoning systems and store well. Liquids serve beverages, sauces and brines, including vinegar-based systems. Granules and Pearls grow fastest at an estimated 6.0% CAGR, boosted by low-dust formats such as the vinegar-based pearls Galactic presented at IFT FIRST in July 2026, which ease handling and dosing. Others covers pastes, emulsions and tailored blends that suppliers such as Brenntag, exhibiting at FoodPro in Melbourne in July 2026, formulate for specific recipes.
Market Breakup by Region
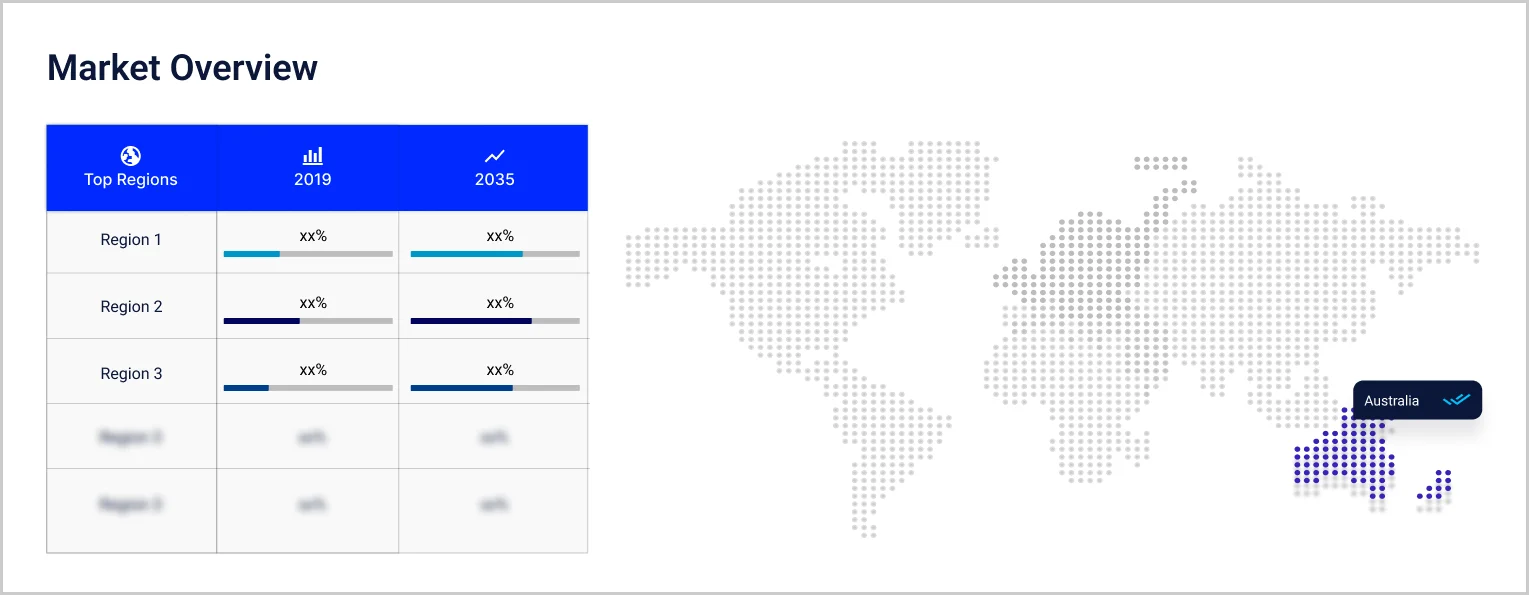
New South Wales dominates through its large bakery, meat and beverage manufacturing base and the Sydney distribution hub, growing at an estimated 4.6% CAGR through 2035. Victoria follows at 4.7%, helped by dairy and ingredient processing and PrimeSafe's active enforcement in Melbourne in February 2026. Queensland grows fastest at an estimated 5.6% on meat processing and population inflow. Western Australia grows at 5.0%. South Australia grows at 4.4%, supported by wine and beverage makers. Others covers Tasmania, the ACT and the Northern Territory at 4.5%.
| CAGR 2026 to 2035, Market by Region | Growth Rate |
| New South Wales | 4.6 % |
| Victoria | 4.7 % |
| Queensland | 5.6 % |
| Western Australia | 5.0 % |
| South Australia | 4.4 % |
| Others (incl. Tasmania, the Australian Capital Territory and the Northern Territory) | 4.5 % |
Competition spans global ingredient houses, specialist preservation suppliers, chemical and ingredient distributors and Australian food makers that formulate in-house. Barriers include regulatory knowledge, technical support, supply reliability and customer trial and validation cycles.
Kerry
Kerry is a taste and nutrition group headquartered in Tralee, Ireland, with Australian operations serving food and beverage makers. Its food protection and preservation range covers clean label preservation, mould inhibition and freshness systems. In July 2026 it presented this work at IFT FIRST, and on 29 July 2026 it reported first half volume growth of 3.3%.
Corbion
Corbion is a Dutch ingredient company headquartered in Amsterdam, focused on food preservation, lactic acid derivatives and nutrition ingredients. On 31 July 2026 it reported first half net sales of EUR 631.1 million and second quarter organic growth of 8.5%. It expects FY26 adjusted EBITDA margin above 16% and organic growth of 3% to 6%.
Brenntag Australia
Brenntag Australia is part of Brenntag, headquartered in Essen, Germany, which reported 2025 sales of EUR 15.2 billion and has about 17,300 employees. The group distributes food ingredients and specialties. In July 2026 it exhibited at FoodPro at the Melbourne Convention and Exhibition Centre under the theme Better by Choice.
Bega Group
Bega Group is an Australian dairy and food company headquartered in Bega, New South Wales, producing cheese, yoghurt, milk beverages, spreads and juice. In August 2026 it reported FY26 revenue of AUD 3,774.6 million, up 6.7%, and normalised EBITDA of AUD 225.6 million. It is a large buyer of shelf life and food safety inputs.
Other players operating in the Australia food preservatives market include Galactic, Tate & Lyle, Redox, Kemin Industries, and Cargill Australia, alongside food makers such as Inghams and Goodman Fielder, ingredient distributors, flavour houses and specialty blend suppliers supplying preservative systems across Australia.
Competition rests on technical support, regulatory knowledge and supply reliability rather than price alone. Global ingredient houses hold range breadth, while distributors win through local service.


Upto 15% Off
AUD
$2749 $2499
$3849 $3499
$4949 $4499
$6049 $5499


*While we strive to always give you current and accurate information, the numbers depicted on the website are indicative and may differ from the actual numbers in the main report. At Expert Market Research, we aim to bring you the latest insights and trends in the market. Using our analyses and forecasts, stakeholders can understand the market dynamics, navigate challenges, and capitalize on opportunities to make data-driven strategic decisions.*
The Australia food preservatives market is valued at AUD 168.00 million in 2025, supported by long supply chains, clean label demand and a widening list of permitted additives.
The market is forecast to reach AUD 268.49 million by 2035, growing at a CAGR of 4.80 % over the 2026 to 2035 period, driven by natural preservative adoption, convenience food growth and tighter compliance expectations that favour well-supported suppliers.
Natural Preservatives records the highest CAGR at an estimated 7.4% through 2035, as food makers adopt vinegar, cultured and plant-derived systems to meet clean label demand.
New South Wales dominates through its large manufacturing base and distribution hub. Queensland is the fastest-growing region at an estimated 5.6% CAGR, helped by meat processing and population inflow.
Key players include Kerry, Corbion, Brenntag Australia, Bega Group, Galactic, Tate & Lyle, Redox, Kemin Industries, and Cargill Australia.
FSANZ gazetted Application A1315 on 16 September 2025, permitting chitosan and beta-glucans from white button mushrooms as a food additive. The applicant was Chinova Bioworks Inc.
PrimeSafe stated in February 2026 that maximum penalties are AUD 40,000 for an individual and AUD 200,000 for a corporation. Its sulphur dioxide case was resolved through a diversion program.
Explore our key highlights of the report and gain a concise overview of key findings, trends, and actionable insights that will empower your strategic decisions.
| REPORT FEATURES | DETAILS |
| Base Year | 2025 |
| Historical Period | 2019-2025 |
| Forecast Period | 2026-2035 |
| Scope of the Report |
Historical and Forecast Trends, Industry Drivers and Constraints, Historical and Forecast Market Analysis by Segment:
|
| Breakup by Preservative Type |
|
| Breakup by Application |
|
| Breakup by Form |
|
| Breakup by Region |
|
| Market Dynamics |
|
| Competitive Landscape |
|
| Companies Covered |
|
Datasheet
AUD 2,749
AUD 2,499
tax inclusive*
Single User License
AUD 3,849
AUD 3,499
tax inclusive*
Five User License
AUD 4,949
AUD 4,499
tax inclusive*
Corporate License
AUD 6,049
AUD 5,499
tax inclusive*
*Please note that the prices mentioned below are starting prices for each bundle type. Kindly contact our team for further details.*
Flash Bundle
Small Business Bundle
Growth Bundle
Enterprise Bundle
*Please note that the prices mentioned below are starting prices for each bundle type. Kindly contact our team for further details.*
Flash Bundle
Number of Reports: 3
20%
tax inclusive*
Small Business Bundle
Number of Reports: 5
25%
tax inclusive*
Growth Bundle
Number of Reports: 8
30%
tax inclusive*
Enterprise Bundle
Number of Reports: 10
35%
tax inclusive*
How To Order

Select License Type
Choose the right license for your needs and access rights.

Click on ‘Buy Now’
Add the report to your cart with one click and proceed to register.

Select Mode of Payment
Choose a payment option for a secure checkout. You will be redirected accordingly.
Strategic Solutions for Informed Decision-Making
Stay upgraded and grab opportunities by strategic insights
Stay informed and aware for a Market Leverage
Analyze pricing patterns with comprehensive trend analyses.
Analyse trade data for supply chain insights.
Leverage cost reports for smart savings
Elevate supply chain with collaboration
Contact Us for Further Information
Our specialized analysts will be available to answer all the pre-purchase and post-purchase queries regarding the report.
Our specialized analysts will be available to answer all the pre-purchase and post-purchase queries regarding the report.
Staying one step ahead of the market landscape with our in-depth research methods, integrating advanced analytics to drive precise and tangible outcomes.
Our expert analyst team offers a significant advantage over competitors, with extensive market insights into the latest trends, putting you strategically ahead.
We deliver a simplified yet extensive report, comprising in-depth industry insights and analytics tailored to your industry requirements.
We are happy to help you navigate through the services we offer and solve your queries.
Contact us