Consumer Insights
Uncover trends and behaviors shaping consumer choices today
Procurement Insights
Optimize your sourcing strategy with key market data
Industry Stats
Stay ahead with the latest trends and market analysis.
The Australia freight forwarding market covers the annual revenue earned by firms that arrange, consolidate and move international and cross-border cargo on behalf of importers and exporters. Services include sea, air, road and rail booking, customs brokerage, biosecurity documentation, warehousing, cargo insurance and project logistics, usually sold on a gross revenue basis.
In 2025, the market is valued at AUD 20.50 billion in 2025 and is forecast to grow at a (CAGR) of 5.10%, reaching AUD 33.71 billion by 2035. Demand rests on a record container trade through the major ports, the opening of new air cargo capacity, tighter border and biosecurity compliance, and a wave of ownership changes among the largest logistics groups.
Compound Annual Growth Rate
5.1%
Value in AUD billion
2026-2035
The Australia freight forwarding market is an intermediary business in which forwarders buy space from shipping lines, airlines and hauliers and resell it with documentation, compliance and storage. Margins depend on buying power, trade lane density and the ability to handle customs and biosecurity paperwork accurately.
Three forces shape the outlook: record port volumes that keep container demand high, new air freight infrastructure at Western Sydney, and rising landside and regulatory costs that favour forwarders with scale, technology and in-house compliance teams.
In April 2025, DSV completed its acquisition of Schenker. In August 2026, a Macquarie Asset Management-led consortium completed its investment in Qube, and in September 2026 Port of Melbourne reported a second consecutive record year for container trade.
Growth is expected to stay ahead of national container volumes as importers outsource more compliance, warehousing and e-commerce fulfilment to forwarders. Sea freight remains the largest mode, with air freight advancing fastest as Western Sydney cargo infrastructure matures. Warehousing and distribution outgrow core forwarding, and agriculture and food shippers expand quicker than other end users. Queensland grows quickest, with Victoria the largest region. Port productivity, biosecurity cost recovery and the integration of large global networks will decide which forwarders capture the next decade of growth.
| Metric | Value |
| Market Size 2025 | AUD 20.50 billion |
| Projected Market Size 2035 | AUD 33.71 billion |
| CAGR 2026 to 2035 | 5.10% |
| Fastest-Growing Mode | Air Freight: 6.3% CAGR |
| Fastest-Growing Service | Warehousing and Distribution: 6.1% CAGR |
| Largest Revenue Segment 2025 | Sea Freight |
| Dominant Region | Victoria |
| Highest CAGR by Region | Queensland: 6.0% |
| Port of Melbourne container trade in the year to June 2026 | 3.52 million TEU |
Forwarding Revenue Compounds Steadily
Forwarding revenue is on course to rise by about 64% across the decade, from AUD 20.50 billion in 2025 to AUD 33.71 billion in 2035 at a 5.1% CAGR. Record port volumes, e-commerce and outsourced compliance keep demand climbing.
Air and Agriculture Lead Growth
Air freight grows at an estimated 6.3% CAGR and agriculture and food shippers at an estimated 6.4% CAGR through 2035. Perishable exports, e-commerce parcels and new Western Sydney capacity pull cargo towards air-linked forwarding.
Compliance and Cost Reshape Competition
Biosecurity cost recovery, customs reporting and rising landside charges are changing forwarder economics. Firms with strong brokerage teams, rail access and warehouse space will be better placed as costs and border expectations rise.
| Report Summary | Unit | Value |
| Base Year | AUD billion | 2025 |
| Historical Period | AUD billion | 2019 to 2025 |
| Forecast Period | AUD billion | 2026 to 2035 |
| Market Size 2025 | AUD billion | 20.50 |
| Market Size 2035 | AUD billion | 33.71 |
| CAGR 2026 to 2035 | Percentage | 5.10 % |
| CAGR by Mode: Air Freight | Percentage | 6.3 % |
| CAGR by Service: Warehousing and Distribution | Percentage | 6.1 % |
| CAGR by End Use: Agriculture and Food | Percentage | 6.4 % |
| CAGR by Region: Queensland | Percentage | 6.0 % |
| Port of Melbourne Container Trade in the Year to June 2026 | Million TEU | 3.52 |
| Mainfreight Australia Revenue in the Year to March 2026 | AUD Million | 1,509.9 |
| Market Share by Region 2025 | Victoria | Dominant Share |
Record port volumes, growing air capacity and outsourced compliance support steady forwarding growth, while rising landside costs and biosecurity charges squeeze margins. Sea freight leads; air and warehousing gain ground.
The Australia freight forwarding market is being shaped by record port trade, higher regulatory and landside costs, and consolidation among the largest global networks.
September 2026 - Port of Melbourne Records a Second Consecutive Year of Record Container Trade
July 2026 - Biosecurity Charges Rise and a Stricter Stink Bug Season Begins
June 2026 - Landside Charges Climb Faster Than Inflation
April 2025 - DSV Completes Its Acquisition of Schenker
Record port trade, higher compliance charges and global network consolidation pull forwarders in different directions. Volume growth sustains demand, but cost recovery and landside pricing shape margins and competition.
Recent developments, presented from the most recent, show the Australia freight forwarding market moving through ownership change, new air cargo capacity and infrastructure investment.
August 2026 - Macquarie-Led Consortium Completes Its Investment in Qube
August 2026 - Qantas Freight Starts Operations at Western Sydney International Airport
August 2026 - Adelaide Intermodal Precinct Begins as Brisbane Stevedores Hold a Stop-Work Meeting
May 2026 - Mainfreight Reports Higher Australian Profit
Recent events show infrastructure owners changing hands while new air cargo capacity opens in Sydney. Forwarders also keep investing in warehouses and cross-docks as port volumes stay strong.
The Expert Market Research’s report on the Australia Freight Forwarding Market offers a detailed analysis of the market based on the following segments.
Market Breakup by Mode
Sea Freight leads revenue, with Port of Melbourne handling a record 3.52 million TEU in the year to June 2026 and Qube completing its change of ownership on 14 August 2026. Air Freight grows fastest at an estimated 6.3% CAGR, as Qantas Freight began Western Sydney operations on 4 August 2026 and Texel Air announced a service in July 2026. Road and Rail Freight benefits from NSW Ports reporting a record 504,000 TEU of on-dock rail on 21 August 2026. Multimodal and Project Cargo follows resource and infrastructure builds, and Mainfreight reported closing its Perth Projects division in May 2026.
Market Breakup by Service
Freight Forwarding and Consolidation leads revenue through booking, consolidation and lane management, and DSV expects half of its Schenker integration by the end of 2026. Customs Brokerage and Border Compliance grows with the Biosecurity Cost Recovery Charge increase of 1 July 2026 and the Australian Border Force duty indexation effective 3 August 2026. Warehousing and Distribution grows fastest at an estimated 6.1% CAGR, with Mainfreight finishing a Brisbane cross-dock in 2026. Value-Added and Cargo Insurance Services covers labelling, quarantine treatment and cover, including onshore ethyl formate treatment approved for the 2026-27 stink bug season.
Market Breakup by End Use
Retail and Consumer Goods lead revenue, and the Landside Port and Air Cargo Terminal Charges Index showed port charges rising at more than double inflation in June 2026. Automotive and Industrial shippers gained from a surge in motor vehicle imports through Fremantle in May 2026. Agriculture and Food grows fastest at an estimated 6.4% CAGR, supported by new Adelaide air capacity such as the China Eastern Shanghai service adding about 45 tonnes weekly in mid-2026. Mining, Energy and Resources relies on specialist project forwarding, while fertiliser suppliers sought alternative sourcing during the 2026 Middle East conflict.
Market Breakup by Region
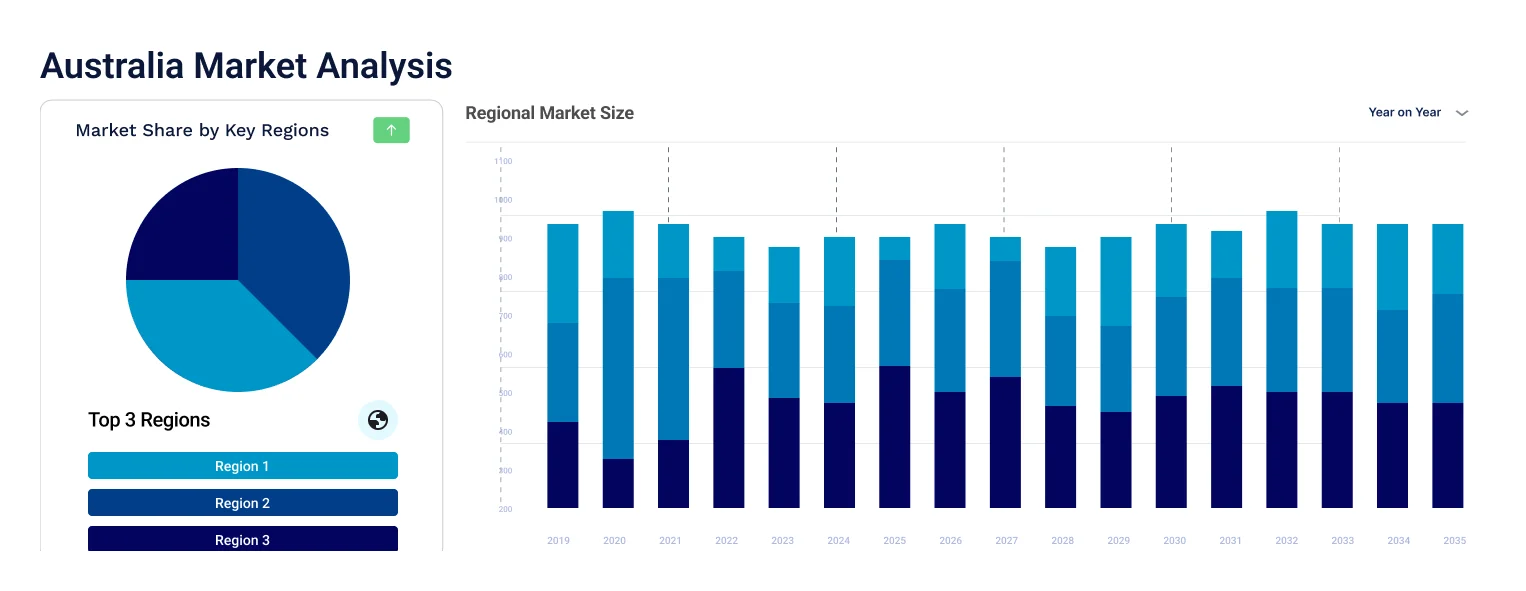
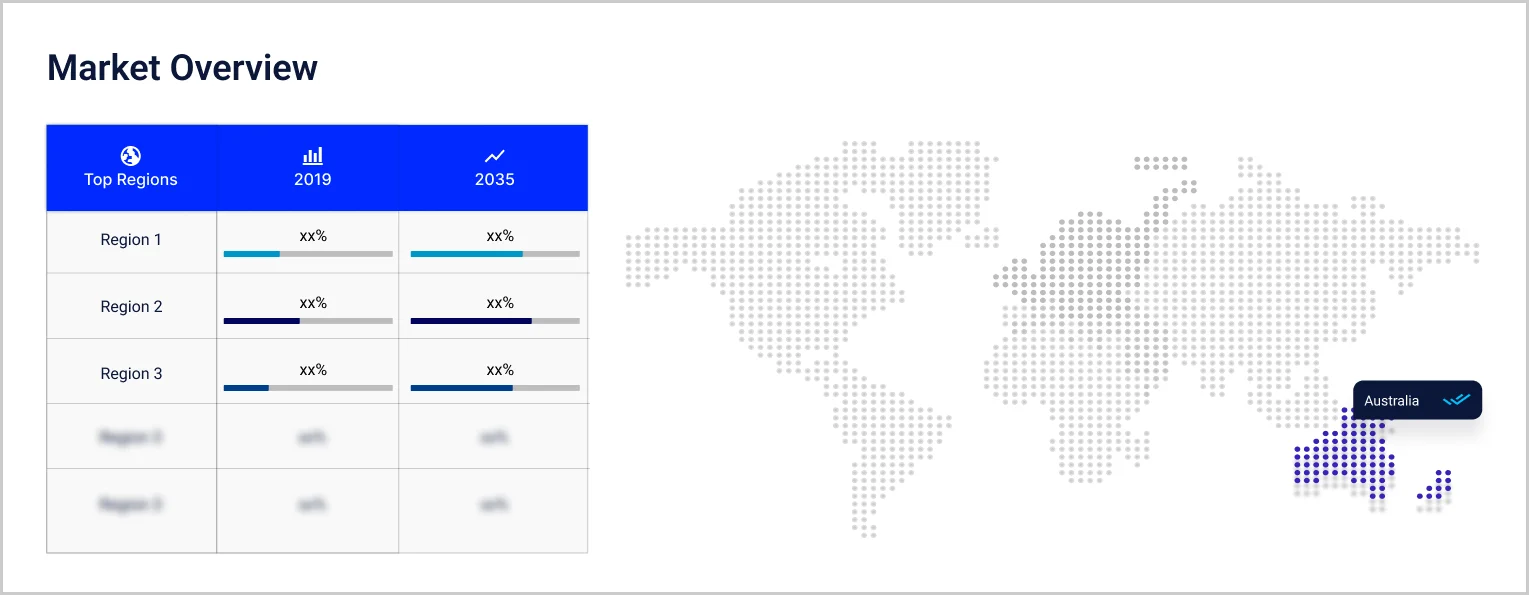
Victoria dominates through the country's largest container port, growing at an estimated 4.8% CAGR through 2035. New South Wales follows at 4.9%, with Port Botany rail records and Western Sydney air cargo. Queensland is the fastest-growing region at an estimated 6.0%, helped by new Brisbane cross-docks. Western Australia grows at 5.5%, with Fremantle publishing June 2026 trade statistics. South Australia grows at 5.2%, backed by a AUD 50 million Adelaide precinct. Others covers Tasmania, the ACT and the Northern Territory at 4.7%, relying on coastal shipping and road linehaul.
| CAGR 2026 to 2035, Market by Region | Growth Rate |
| Victoria | 4.8 % |
| New South Wales | 4.9 % |
| Queensland | 6.0 % |
| Western Australia | 5.5 % |
| South Australia | 5.2 % |
| Others (incl. Tasmania, the Australian Capital Territory and the Northern Territory) | 4.7 % |
Competition spans global forwarding networks, ports and logistics groups, airline cargo arms, regional specialists and customs brokers. Barriers include carrier buying power, warehouse and cross-dock networks, customs and biosecurity accreditation, and technology for booking and tracking.
Mainfreight
Mainfreight, headquartered in Auckland, New Zealand, provides air and ocean forwarding, domestic transport and warehousing across Australia. On 27 May 2026 it reported Australian revenue of AUD 1.51 billion and profit before tax of AUD 152.6 million, up 11.1%. It operates 15 warehouses in Australia and is completing a Brisbane cross-dock.
Qube Holdings
Qube Holdings, headquartered in Sydney, operates ports, terminals, rail and logistics services that feed container and bulk forwarding. A Macquarie Asset Management-led consortium completed its investment on 14 August 2026, valued at about AUD 11.7 billion. The earlier proposal of 23 November 2025 offered AUD 5.20 per share.
DSV
DSV, headquartered in Hedehusene, Denmark, offers air and sea freight, customs clearance and contract logistics from offices in Perth, Adelaide, Melbourne, Sydney and Brisbane. It completed the acquisition of Schenker in April 2025 and expects to finish integration by the end of 2028, with half complete by the end of 2026.
Qantas Freight
Qantas Freight, part of Qantas Group and headquartered in Sydney, carries domestic and international air cargo and parcels for forwarders and Australia Post. It began operations from Western Sydney International Airport on 4 August 2026, with a 24,000 square metre terminal, and plans international services from early 2027.
Other players operating in the Australia freight forwarding market include Kuehne+Nagel, DHL Global Forwarding, Toll Group, Expeditors, and CEVA Logistics, alongside regional forwarders, customs brokers, airline cargo arms and warehousing specialists moving cargo across Australia.
Competition rests on carrier buying power, warehouse reach, compliance skill and technology rather than rate alone. Global networks defend share while infrastructure owners and airline cargo arms push into forwarding.


Upto 15% Off
AUD
$2749 $2499
$3849 $3499
$4949 $4499
$6049 $5499


*While we strive to always give you current and accurate information, the numbers depicted on the website are indicative and may differ from the actual numbers in the main report. At Expert Market Research, we aim to bring you the latest insights and trends in the market. Using our analyses and forecasts, stakeholders can understand the market dynamics, navigate challenges, and capitalize on opportunities to make data-driven strategic decisions.*
The Australia freight forwarding market is valued at AUD 20.50 billion in 2025, supported by record port volumes, new air cargo capacity and growth in outsourced compliance and warehousing.
The market is forecast to reach AUD 33.71 billion by 2035, growing at a CAGR of 5.10 % over the 2026 to 2035 period, driven by sea freight demand, air cargo expansion at Western Sydney and rising biosecurity and customs compliance needs.
Air Freight records the highest CAGR at an estimated 6.3% through 2035, as Qantas Freight began Western Sydney International Airport operations on 4 August 2026 and Texel Air announced a service in July 2026.
Victoria dominates through Port of Melbourne, the largest container port. Queensland is the fastest-growing region at an estimated 6.0% CAGR, supported by new Brisbane cross-dock capacity and rising import demand.
Key players include Mainfreight, Qube Holdings, DSV, Qantas Freight, Kuehne+Nagel, DHL Global Forwarding, Toll Group, Expeditors, and CEVA Logistics.
Australian Customs Notice 2026/23 increased the Biosecurity Cost Recovery Charge from 1 July 2026 for full import declarations above AUD 1,000. On 31 July 2026 the national audit office called for more transparent cost recovery.
On 17 September 2026 Port of Melbourne reported a record 3.52 million TEU, its second consecutive record year. It cited United States tariff changes and Strait of Hormuz instability as supply chain pressures.
Explore our key highlights of the report and gain a concise overview of key findings, trends, and actionable insights that will empower your strategic decisions.
| REPORT FEATURES | DETAILS |
| Base Year | 2025 |
| Historical Period | 2019-2025 |
| Forecast Period | 2026-2035 |
| Scope of the Report |
Historical and Forecast Trends, Industry Drivers and Constraints, Historical and Forecast Market Analysis by Segment:
|
| Breakup by Mode |
|
| Breakup by Service |
|
| Breakup by End Use |
|
| Breakup by Region |
|
| Market Dynamics |
|
| Competitive Landscape |
|
| Companies Covered |
|
Datasheet
AUD 2,749
AUD 2,499
tax inclusive*
Single User License
AUD 3,849
AUD 3,499
tax inclusive*
Five User License
AUD 4,949
AUD 4,499
tax inclusive*
Corporate License
AUD 6,049
AUD 5,499
tax inclusive*
*Please note that the prices mentioned below are starting prices for each bundle type. Kindly contact our team for further details.*
Flash Bundle
Small Business Bundle
Growth Bundle
Enterprise Bundle
*Please note that the prices mentioned below are starting prices for each bundle type. Kindly contact our team for further details.*
Flash Bundle
Number of Reports: 3
20%
tax inclusive*
Small Business Bundle
Number of Reports: 5
25%
tax inclusive*
Growth Bundle
Number of Reports: 8
30%
tax inclusive*
Enterprise Bundle
Number of Reports: 10
35%
tax inclusive*
How To Order

Select License Type
Choose the right license for your needs and access rights.

Click on ‘Buy Now’
Add the report to your cart with one click and proceed to register.

Select Mode of Payment
Choose a payment option for a secure checkout. You will be redirected accordingly.
Strategic Solutions for Informed Decision-Making
Stay upgraded and grab opportunities by strategic insights
Stay informed and aware for a Market Leverage
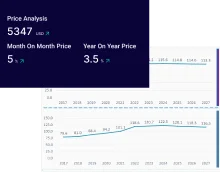
Analyze pricing patterns with comprehensive trend analyses.
Analyse trade data for supply chain insights.
Leverage cost reports for smart savings
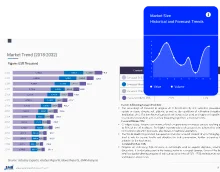
Elevate supply chain with collaboration
Contact Us for Further Information
Our specialized analysts will be available to answer all the pre-purchase and post-purchase queries regarding the report.
Our specialized analysts will be available to answer all the pre-purchase and post-purchase queries regarding the report.
Staying one step ahead of the market landscape with our in-depth research methods, integrating advanced analytics to drive precise and tangible outcomes.
Our expert analyst team offers a significant advantage over competitors, with extensive market insights into the latest trends, putting you strategically ahead.
We deliver a simplified yet extensive report, comprising in-depth industry insights and analytics tailored to your industry requirements.
We are happy to help you navigate through the services we offer and solve your queries.
Contact us