Consumer Insights
Uncover trends and behaviors shaping consumer choices today
Procurement Insights
Optimize your sourcing strategy with key market data
Industry Stats
Stay ahead with the latest trends and market analysis.
The Australia dental devices market covers the implants, prosthetics, imaging systems, intraoral scanners, clear aligners, handpieces, chairside equipment and consumables that dentists, specialists and laboratories use to diagnose, restore and straighten teeth. Most of these products are regulated as medical devices and must be entered on the Australian Register of Therapeutic Goods before supply, which favours established importers and distributors with compliance teams.
In 2025, the market is valued at AUD 1060.00 million in 2025 and is forecast to grow at a CAGR of 5.60%, reaching AUD 1827.87 million by 2035. Growth is driven by a shift to digital workflows, rising demand for implants and aligners, and public funding for dental care, against a national dental bill of roughly AUD 12.5 billion a year, most of it paid directly by patients.
Compound Annual Growth Rate
5.6%
Value in AUD million
2026-2035
The Australia dental devices market is expanding because clinics are re-equipping around digital scanning, three-dimensional imaging and implant-led treatment, while patients ask for aligners and cosmetic work. Almost every product is imported, so exchange rates, tariffs and global supplier results shape local pricing and availability.
Three forces are shaping the market: digitisation, as intraoral scanners and cloud design platforms replace impressions; consolidation, as corporate dental groups standardise equipment purchasing across many sites; and public funding, because Medicare does not cover general dental care and the Child Dental Benefits Schedule is costed at AUD 325.9 million for 2025-26.
In July 2025 the Commonwealth began a AUD 107.76 million agreement for additional adult public dental services, which ran to 30 June 2026. In August 2026 Straumann reported that Asia Pacific outside China grew 25.0% in the second quarter, led partly by Australia.
The market is moving from analogue impressions, film radiography and conventional restorations towards digital scanning, cone beam imaging, guided implant surgery and aligner-led orthodontics. Dental consumables lead in value because every appointment uses disposable products, while imaging and digital systems advance fastest as clinics replace ageing equipment. Private dental clinics remain the biggest buyers, and corporate dental groups grow quickest as they roll out standard platforms across sites. Implantology is the fastest application, supported by an ageing population. New South Wales remains the largest region, and Queensland grows quickest on population inflow. Regulatory scrutiny of unlisted products, growth in cloud workflows and funding debates point to a durable change in product mix rather than a cyclical uplift.
| Metric | Value |
| Market Size 2025 | AUD 1060.00 million |
| Projected Market Size 2035 | AUD 1827.87 million |
| CAGR 2026 to 2035 | 5.60% |
| Fastest-Growing Product Type | Imaging and Digital Systems: 7.6% CAGR |
| Fastest-Growing Application | Implantology: 7.0% CAGR |
| Largest Revenue Segment 2025 | Dental Consumables |
| Dominant Region | New South Wales |
| Highest CAGR by Region | Queensland: 6.5% |
| Child Dental Benefits Schedule cost, 2025-26 | AUD 325.9 million |
Digital Re-Equipping Anchors Long-Term Demand
Revenue is on course to expand by about 72% across the decade, from AUD 1,060.00 million in 2025 to AUD 1,827.87 million in 2035 at a 5.6% CAGR. Clinics that adopt scanners, imaging and cloud platforms create recurring demand for software, consumables and replacement hardware.
Imaging, Implants and Group Buyers Lead Growth
Dental Consumables hold the largest share, but Imaging and Digital Systems grow at an estimated 7.6% CAGR and Implantology at an estimated 7.0% CAGR through 2035. Straumann's August 2026 comment on Australia and 3Shape's TRIOS 6 launch in March 2025 show where suppliers are investing.
Public Funding Debate Shapes Patient Access
Medicare does not cover general dental care, so most spending is private and clinics buy equipment against patient out-of-pocket demand. Commonwealth programmes sustain only part of the need, and any expansion would lift treatment volumes.
| Report Summary | Unit | Value |
| Base Year | AUD million | 2025 |
| Historical Period | AUD million | 2019 to 2025 |
| Forecast Period | AUD million | 2026 to 2035 |
| Market Size 2025 | AUD million | 1060.00 |
| Market Size 2035 | AUD million | 1827.87 |
| CAGR 2026 to 2035 | Percentage | 5.60 % |
| CAGR by Product Type: Imaging and Digital Systems | Percentage | 7.6 % |
| CAGR by Application: Implantology | Percentage | 7.0 % |
| CAGR by End User: Corporate Dental Groups | Percentage | 6.3 % |
| CAGR by Region: Queensland | Percentage | 6.5 % |
| Child Dental Benefits Schedule Cost 2025-26 | AUD Million | 325.90 |
| Adult Public Dental Agreement 2025 | AUD Million | 107.76 |
| Market Share by Region 2025 | New South Wales | Dominant Share |
Digital workflows, implant treatment and aligner demand are lifting equipment spending, while consumables remain the largest base. New South Wales leads and Queensland grows fastest.
The Australia dental devices market is being reshaped by strong implant and aligner demand, fast-growing international distribution, digital scanning and heavier dependence on imported technology.
August 2026 - Straumann Reports Asia Pacific Growth of 25.0% Outside China
August 2026 - Henry Schein Lifts Guidance as International Dental Sales Climb 10.6%
July 2026 - Align Technology Ships Record Clear Aligner Cases on Asia Pacific Growth
March 2025 - 3Shape Launches the Wireless TRIOS 6 Intraoral Scanner
Strong implant and aligner demand, expanding distribution and diagnostic scanning are the main structural forces, while import dependence and exchange rates remain the main risks to margins.
Recent developments, presented from the most recent, show supplier results in a mixed market, the end of a public dental funding agreement and a higher child dental benefits cap.
August 2026 - Dentsply Sirona Reports Lower Sales Under Its Return-to-Growth Plan
August 2026 - Envista Posts Second-Quarter Sales of USD 730.5 Million
June 2026 - Commonwealth Adult Public Dental Agreement Reaches Its End Date
October 2025 - Child Dental Benefits Schedule Cap Indexed to AUD 1,158 for 2026
Mixed supplier results, a lapsed public funding agreement and an indexed child benefits cap show suppliers positioning for private, digital and implant-led demand through the forecast period.
The Expert Market Research’s report on the Australia Dental Devices Market offers a detailed analysis of the market based on the following segments.
Market Breakup by Product Type
Dental Consumables lead on value, in our estimate, because every visit uses restorative materials, disposables and infection control items. Imaging and Digital Systems grow fastest at an estimated 7.6% CAGR through 2035, shown by 3Shape's TRIOS 6 launch in March 2025 and Straumann's strong SIRIOS X3 growth in August 2026. Dental Implants and Prosthetics expand on Straumann and Envista's premium ranges. Orthodontic Devices gain from Align's record 691,785 cases in July 2026. Handpieces and Chairside Equipment follow the steady replacement cycle at Henry Schein and Dentsply Sirona.
Market Breakup by Application
Restorative and Prosthodontic work leads, in our estimate, as crowns, bridges and fillings account for the most chair time. Implantology grows fastest at an estimated 7.0% CAGR through 2035, backed by Straumann's August 2026 remark that Australia helped lift Asia Pacific outside China by 25.0%. Orthodontics grows at about 6.8%, helped by Align's double-digit Asia Pacific expansion reported in July 2026. Endodontic and Periodontic care grows steadily on an ageing population. Preventive and Diagnostic use rises as AI-assisted scanning, such as TRIOS Dx Plus, widens screening.
Market Breakup by End User
Private Dental Clinics lead, in our estimate, because most adult dental care is paid for by patients rather than Medicare. Corporate Dental Groups grow fastest at an estimated 6.3% CAGR through 2035, as group purchasing standardises scanners, imaging and implant systems across sites. Dental Laboratories advance as digital design and milling replace manual casting. Public Dental Services and Hospitals depend on government funding, including the AUD 107.76 million adult agreement that ran from 14 July 2025 to 30 June 2026 and then expired.
Market Breakup by Region
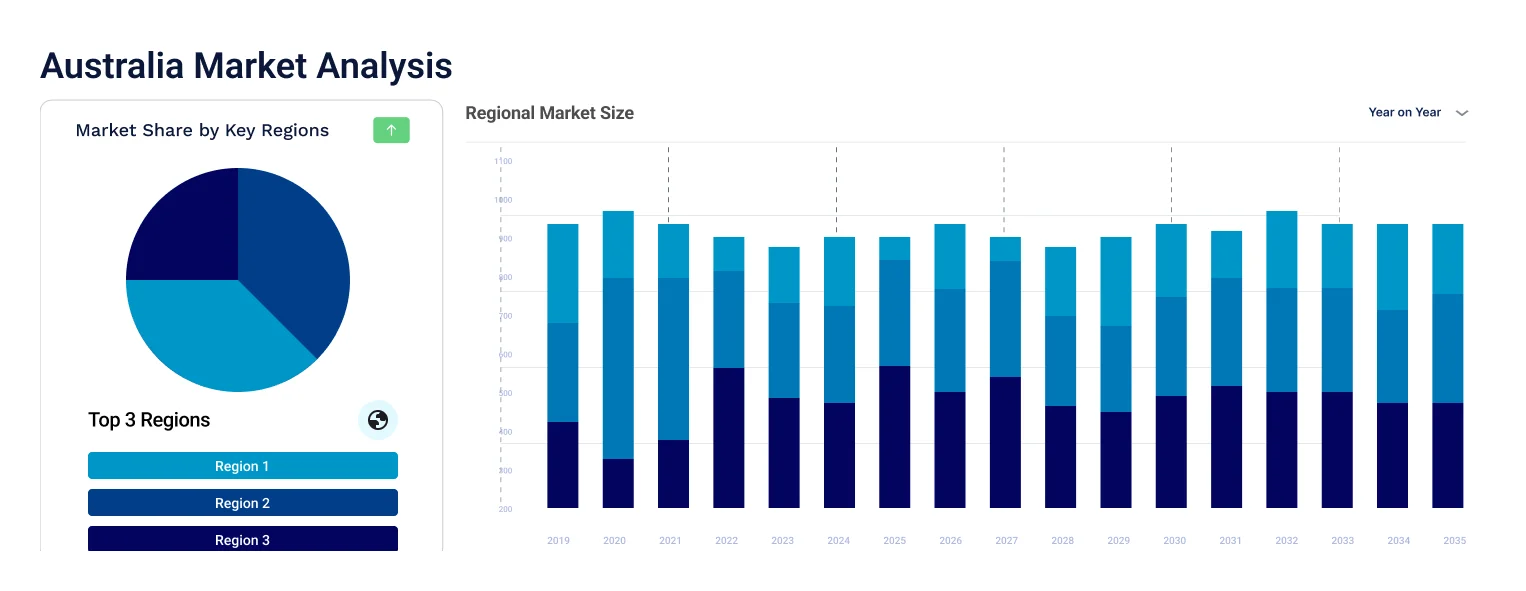
New South Wales dominates, in our estimate, as the most populous state with the densest cluster of private clinics, specialists and laboratories, and it grows at an estimated 5.3% CAGR through 2035 from a large, mature base. Queensland is the fastest-growing region at an estimated 6.5%, on population inflow and new clinic openings, in our estimate. Victoria grows at 5.5%, supported by its large specialist base. Western Australia grows at 5.9% on resource-sector incomes. Others, covering the remaining states and territories, grow at 5.4% from smaller bases and thinner supplier coverage.
| CAGR 2026 to 2035, Market by Region | Growth Rate |
| New South Wales | 5.3 % |
| Victoria | 5.5 % |
| Queensland | 6.5 % |
| Western Australia | 5.9 % |
| Others (incl. South Australia, Tasmania, Australian Capital Territory and Northern Territory) | 5.4 % |
Competition combines global implant and imaging manufacturers, aligner specialists and full-line distributors. Entry barriers include Australian Register of Therapeutic Goods listing, clinician training, local service networks, software ecosystems and relationships with dental groups, laboratories and public services.
Straumann Group
Straumann Group, headquartered in Basel, Switzerland, sells premium dental implants, biomaterials, digital solutions and ClearCorrect aligners. On 19 August 2026 it reported second-quarter organic growth of 8.5% and Asia Pacific growth of 25.0% outside China, naming Australia among leading markets. It said its iEXCEL implant line made up close to 40% of premium implant volumes in the first half and highlighted the SIRIOS X3 scanner and AXS platform.
Dentsply Sirona
Dentsply Sirona, headquartered in Charlotte, North Carolina, supplies consumables, implants, orthodontic products, imaging and CAD/CAM systems such as Primescan. On 6 August 2026 it reported second-quarter net sales down 4.1% to USD 898 million, with Orthodontic and Implant Solutions down 13.2%. Chief Executive Dan Scavilla said the company is making meaningful progress under its Return-to-Growth plan, and 2026 sales guidance was held.
Align Technology
Align Technology, headquartered in Tempe, Arizona, makes the Invisalign clear aligner system and iTero intraoral scanners. On 29 July 2026 it reported record second-quarter revenue of USD 1,056.2 million and 691,785 clear aligner cases, up 7.4%. Chief Executive Joe Hogan cited continued double-digit expansion across Asia Pacific, and the company expects iTero scanner shipments to grow by double digits in 2026.
Henry Schein
Henry Schein, headquartered in Melville, New York, distributes dental consumables, equipment and software to practices, and operates in Australia through its Henry Schein Halas business. On 4 August 2026 it reported second-quarter sales up 6.7% to about USD 3.5 billion and international dental sales up 10.6%. It raised its 2026 sales growth guidance to between 4.5% and 5.5%.
Other players operating in the Australia dental devices market include Envista, Ivoclar, 3Shape, Carestream Dental, and Osstem Implant, alongside local distributors, independent dental laboratories, regional importers and specialist suppliers serving clinics, dental groups, laboratories and public services across Australia.
Competition rests on regulatory listing, clinical training, digital ecosystems and distributor reach rather than price alone, while supplier restructuring and distributor strength could reshape positions.


Upto 15% Off
AUD
$2749 $2499
$3849 $3499
$4949 $4499
$6049 $5499


*While we strive to always give you current and accurate information, the numbers depicted on the website are indicative and may differ from the actual numbers in the main report. At Expert Market Research, we aim to bring you the latest insights and trends in the market. Using our analyses and forecasts, stakeholders can understand the market dynamics, navigate challenges, and capitalize on opportunities to make data-driven strategic decisions.*
The Australia dental devices market is valued at AUD 1060.00 million in 2025, supported by digital workflows, rising implant and aligner demand and a large private patient base, with New South Wales as the largest region.
The market is forecast to reach AUD 1827.87 million by 2035, growing at a CAGR of 5.60 % over the 2026 to 2035 period, driven by scanner and imaging upgrades, implant-led treatment, corporate group purchasing and an ageing population.
Imaging and Digital Systems records the highest CAGR at an estimated 7.6% through 2035, as intraoral scanners, cone beam imaging and AI-assisted diagnostics replace impressions and film.
New South Wales dominates, as the most populous state with the largest concentration of clinics and laboratories. Queensland is the fastest-growing region at an estimated 6.5% CAGR, helped by population inflow.
Key players include Straumann Group, Dentsply Sirona, Align Technology, Henry Schein, Envista, Ivoclar, 3Shape, Carestream Dental, and Osstem Implant.
It is a Commonwealth programme giving eligible children means-tested benefits of up to AUD 1,132 over two years for basic dental care. It is costed at AUD 325.9 million for 2025-26.
Yes. Most dental products are medical devices that must be entered on the Australian Register of Therapeutic Goods before supply, and the Therapeutic Goods Administration can act against unlisted implants and materials.
Explore our key highlights of the report and gain a concise overview of key findings, trends, and actionable insights that will empower your strategic decisions.
| REPORT FEATURES | DETAILS |
| Base Year | 2025 |
| Historical Period | 2019-2025 |
| Forecast Period | 2026-2035 |
| Scope of the Report |
Historical and Forecast Trends, Industry Drivers and Constraints, Historical and Forecast Market Analysis by Segment:
|
| Breakup by Product Type |
|
| Breakup by Application |
|
| Breakup by End User |
|
| Breakup by Region |
|
| Market Dynamics |
|
| Competitive Landscape |
|
| Companies Covered |
|
Datasheet
AUD 2,749
AUD 2,499
tax inclusive*
Single User License
AUD 3,849
AUD 3,499
tax inclusive*
Five User License
AUD 4,949
AUD 4,499
tax inclusive*
Corporate License
AUD 6,049
AUD 5,499
tax inclusive*
*Please note that the prices mentioned below are starting prices for each bundle type. Kindly contact our team for further details.*
Flash Bundle
Small Business Bundle
Growth Bundle
Enterprise Bundle
*Please note that the prices mentioned below are starting prices for each bundle type. Kindly contact our team for further details.*
Flash Bundle
Number of Reports: 3
20%
tax inclusive*
Small Business Bundle
Number of Reports: 5
25%
tax inclusive*
Growth Bundle
Number of Reports: 8
30%
tax inclusive*
Enterprise Bundle
Number of Reports: 10
35%
tax inclusive*
How To Order

Select License Type
Choose the right license for your needs and access rights.

Click on ‘Buy Now’
Add the report to your cart with one click and proceed to register.

Select Mode of Payment
Choose a payment option for a secure checkout. You will be redirected accordingly.
Strategic Solutions for Informed Decision-Making
Stay upgraded and grab opportunities by strategic insights
Stay informed and aware for a Market Leverage
Analyze pricing patterns with comprehensive trend analyses.
Analyse trade data for supply chain insights.

Leverage cost reports for smart savings
Elevate supply chain with collaboration
Contact Us for Further Information
Our specialized analysts will be available to answer all the pre-purchase and post-purchase queries regarding the report.
Our specialized analysts will be available to answer all the pre-purchase and post-purchase queries regarding the report.
Staying one step ahead of the market landscape with our in-depth research methods, integrating advanced analytics to drive precise and tangible outcomes.
Our expert analyst team offers a significant advantage over competitors, with extensive market insights into the latest trends, putting you strategically ahead.
We deliver a simplified yet extensive report, comprising in-depth industry insights and analytics tailored to your industry requirements.
We are happy to help you navigate through the services we offer and solve your queries.
Contact us