Consumer Insights
Uncover trends and behaviors shaping consumer choices today
Procurement Insights
Optimize your sourcing strategy with key market data
Industry Stats
Stay ahead with the latest trends and market analysis.
The Australia OOH and DOOH market covers the net media revenue earned from out-of-home advertising, including roadside billboards, street furniture, transport and airport media, retail and place-based screens, and the digital out-of-home networks and programmatic trading that now sit across them. Revenue comes from booked campaigns sold by media owners to brands and agencies, measured by audience currency.
In 2025, the market is valued at AUD 1.50 billion and is forecast to grow at a CAGR of 6.40%, reaching AUD 2.79 billion by 2035. Growth is driven by the shift from static to digital faces, new rail and airport concessions, the MOVE audience measurement standard and the early rise of programmatic buying.
Compound Annual Growth Rate
6.4%
Value in AUD billion
2026-2035
The Australia OOH and DOOH market is expanding faster than most media channels. Outdoor Media Association members booked record revenue in 2025, and digital faces now carry about three quarters of every dollar, so growth depends on screens, audience data and new transport sites rather than on adding printed posters.
Three forces are shaping demand: conversion of roadside and street furniture sites to digital; large rail, metro and airport concessions that deliver captive audiences; and a measurement and trading upgrade that lets planners compare outdoor with other media and buy it programmatically.
In March 2026 the Outdoor Media Association made MOVE the single industry currency, in April 2026 JCDecaux won the Western Sydney International Airport tender, and in August 2026 I Squared Capital proposed to acquire oOh!media, which signals investor confidence.
The market is moving from booked static posters towards digital, measured and increasingly automated outdoor inventory. Roadside billboards and digital screens still lead because they carry the largest audiences and most existing sites, while rail, metro and airport media, mobile and immersive displays and programmatic trading advance fastest as new concessions open and MOVE data builds buyer confidence. New South Wales remains the largest base, and Queensland grows quickest from a smaller one. Concession renewals, a single measurement currency and private capital entering the sector support a durable multi-year outlook in which audience data and digital coverage, rather than site count, decide where budgets go.
| Metric | Value |
| Market Size 2025 | AUD 1.50 billion |
| Projected Market Size 2035 | AUD 2.79 billion |
| CAGR 2026 to 2035 | 6.40% |
| Fastest-Growing Media Format | Rail, Metro and Transit: 8.4% CAGR |
| Fastest-Growing Display Technology | Mobile and Truck-Mounted Billboards: 10.2% CAGR |
| Largest Revenue Segment 2025 | Roadside Billboards |
| Dominant Region | New South Wales |
| Highest CAGR by Region | Queensland: 7.2% |
| Digital share of industry revenue, third quarter 2026 | 77% |
Digital Conversion Sustains Growth
Revenue is set to rise from AUD 1.50 billion in 2025 to AUD 2.79 billion in 2035 at a 6.4% CAGR, as digital faces, new concessions and better data lift yield per site.
Transit and Programmatic Lead Growth
Roadside billboards remain the largest format, but rail, metro and transit media grows at an estimated 8.4% CAGR and programmatic guaranteed buying at 14.6% through 2035, helped by MOVE.
Concessions and Capital Shape Competition
Long transport concessions and a pending change of ownership at the largest operator define who controls the best audiences over the next decade.
| Report Summary | Unit | Value |
| Base Year | AUD billion | 2025 |
| Historical Period | AUD billion | 2019 to 2025 |
| Forecast Period | AUD billion | 2026 to 2035 |
| Market Size 2025 | AUD billion | 1.50 |
| Market Size 2035 | AUD billion | 2.79 |
| CAGR 2026 to 2035 | Percentage | 6.40 % |
| CAGR by Media Format: Rail, Metro and Transit | Percentage | 8.4 % |
| CAGR by Display Technology: Mobile and Truck-Mounted Billboards | Percentage | 10.2 % |
| CAGR by Trading Method: Programmatic Guaranteed | Percentage | 14.6 % |
| CAGR by Region: Queensland | Percentage | 7.2 % |
| Industry Net Media Revenue 2025 | AUD Million | 1,449.5 |
| Digital Share of Industry Revenue 2025 | Percentage | 76.6 |
| Market Share by Region 2025 | New South Wales | Dominant Share |
Digital conversion, transport concessions and a unified measurement currency shape demand. Rail, metro and programmatic buying advance fastest, while roadside billboards remain the largest and most widely booked format.
The Australia OOH and DOOH market is being reshaped by rising digital share, retail network expansion, a single audience currency and the early growth of programmatic trading.
October 2026 - Digital Share Reaches 77% as Third-Quarter Revenue Climbs
June 2026 - VMO Extends Its Retail Outdoor Network to 550 Locations
March 2026 - MOVE Becomes the Single Outdoor Audience Currency
September 2025 - Programmatic Outdoor Targets a Larger Share of Digital
Digital faces, a single measurement currency and expanding retail networks are lifting confidence, while programmatic buying stays a small but fast-growing share that media owners are racing to scale.
Recent developments, presented from the most recent, show the Australia OOH and DOOH market moving from ownership change and concession wins into new airport, rail and council networks.
August 2026 - I Squared Capital Proposes to Acquire oOh!media
May 2026 - JCDecaux Wins Two Sydney Council Contracts
April 2026 - JCDecaux Secures Western Sydney International Airport
March 2026 - JCDecaux Retains the Yarra Trams Concession
Recent events show private capital, long transport concessions and new airport networks converging, giving the market clearer ownership signals and secured audiences for the coming decade.
The Expert Market Research’s report on the Australia OOH And DOOH Market offers a detailed analysis of the market based on the following segments.
Market Breakup by Media Format
Roadside Billboards lead, earning AUD 591.5 million in 2025 according to the Outdoor Media Association. Rail, Metro and Transit grows fastest at an estimated 8.4% CAGR, after oOh!media opened close to 200 assets across five Melbourne Metro Tunnel stations in October 2025 and JCDecaux retained Yarra Trams in March 2026. Street Furniture and Small Format advances on Burwood and Ku-ring-gai awards in May 2026. Airports gain from JCDecaux's July 2025 Sydney Airport sites and the April 2026 Western Sydney tender. Retail and Place-Based Screens expand with VMO's 550 locations. Others cover office, health club and coworking screens.
Market Breakup by Display Technology
Digital LED and LCD Screens lead, with digital taking 76.6% of 2025 revenue and 77% in the third quarter of 2026. Mobile and Truck-Mounted Billboards grow fastest at an estimated 10.2% CAGR, and Hyped Media, which runs LED billboard trucks, joined the Outdoor Media Association in October 2026. 3D Anamorphic and Immersive Displays follow, as shown by oOh!media's Town Hall installation in October 2025. Static and Printed Formats decline in share but persist, with QMS planning digital conversion of three premium static Sydney sites after its March 2026 agreement with Australian Outdoor Media.
Market Breakup by Trading Method
Direct and Guaranteed Booking leads because planners still reserve premium faces through agencies, and programmatic accounted for only about 8% of digital revenue in the first quarter of 2026. Programmatic Guaranteed grows fastest at an estimated 14.6% CAGR, helped by JCDecaux's September 2025 goal of a 40% programmatic share by 2030. Private Marketplace grows more slowly, as IAB Australia's August 2025 programmatic guide encourages curated deals. Open Exchange expands from the smallest base, since MOVE data and the sector's transparency work are still building buyer trust in open auctions.
Market Breakup by Region
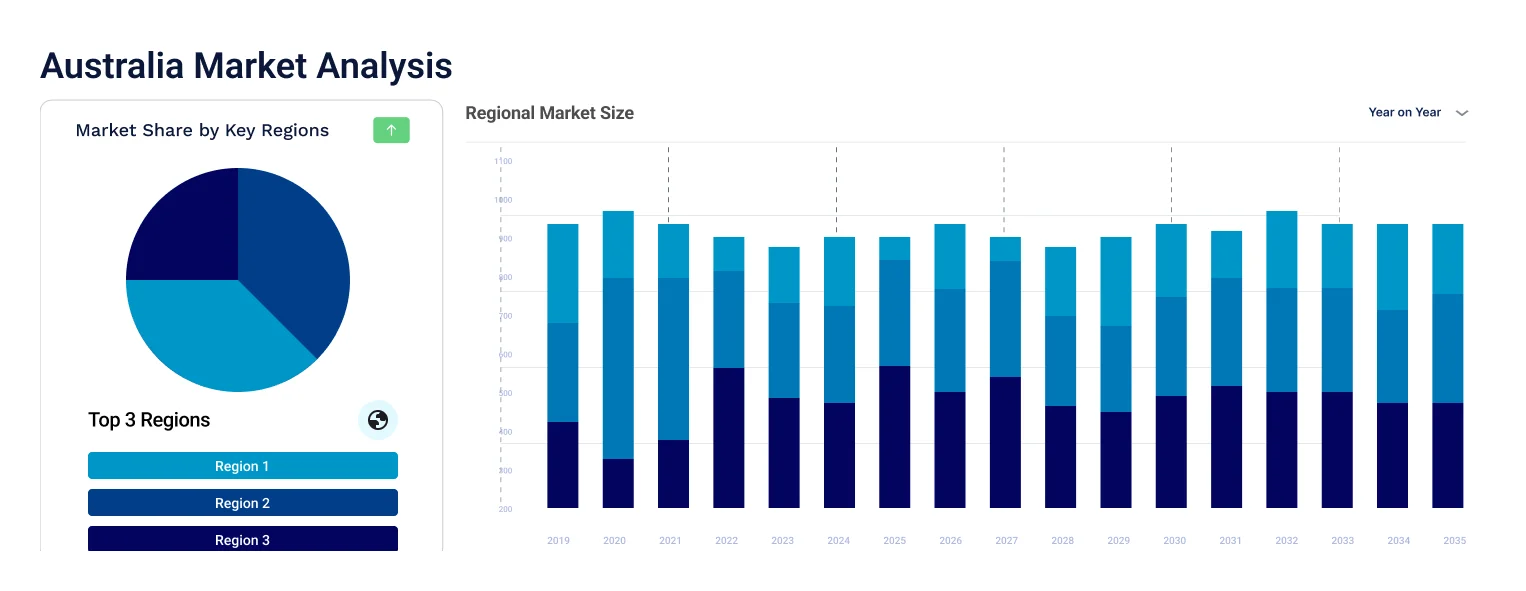
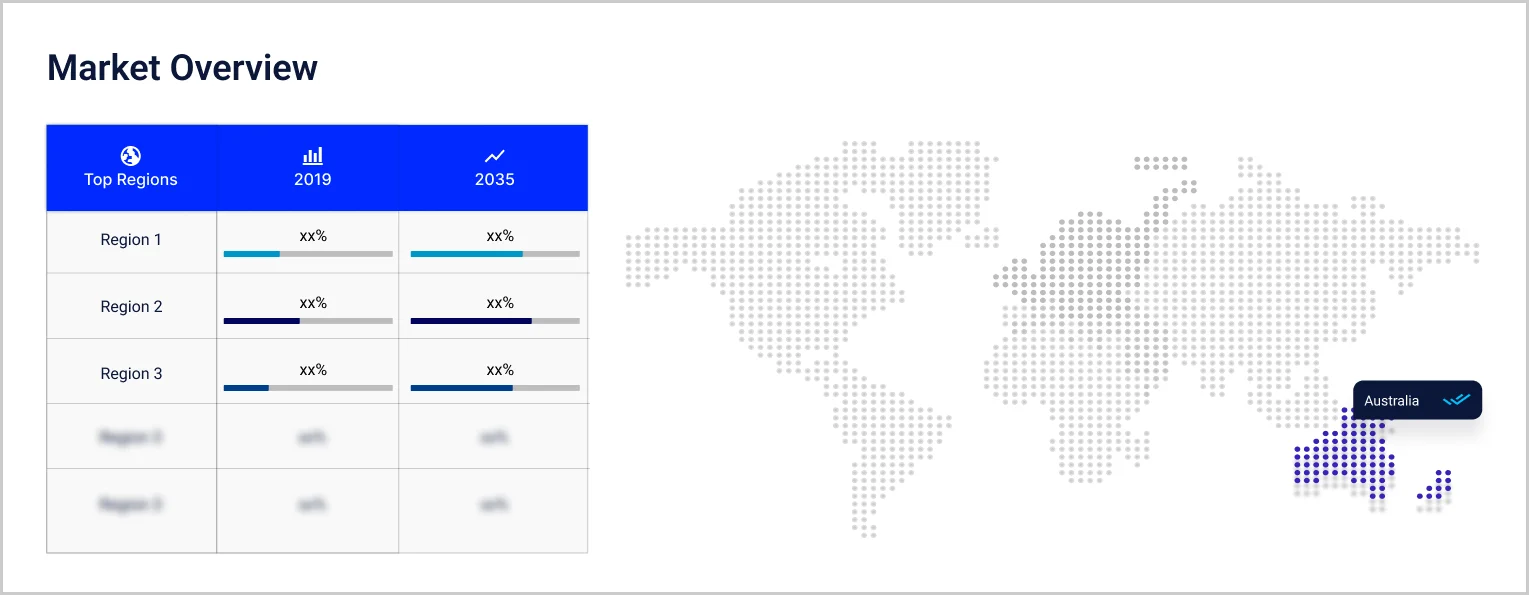
New South Wales dominates, supported by Sydney Metro, which oOh!media said in May 2025 had carried more than 100 brands, and by Sydney Airport, and grows at an estimated 6.1% CAGR. Queensland is fastest at an estimated 7.2%, helped by QMS adding Eagle Farm and Bowen Hills sites in Brisbane in March 2026. Victoria grows at 6.6% on the Metro Tunnel and Yarra Trams networks, although a Legislative Council petition open until December 2026 seeks a ban on electric billboards. Western Australia grows at 6.9% under Main Roads digital sign guidelines. Others, grouping South Australia, Tasmania, the ACT and the Northern Territory, grow at 5.9%.
| CAGR 2026 to 2035, Market by Region | Growth Rate |
| New South Wales | 6.1 % |
| Victoria | 6.6 % |
| Queensland | 7.2 % |
| Western Australia | 6.9 % |
| Others (incl. South Australia, Tasmania, Australian Capital Territory and Northern Territory) | 5.9 % |
Competition combines listed and private-equity-backed network operators, global transport specialists and independent mobile and regional media owners. Entry barriers include long concession tenders, capital for digital conversion, council and state planning approvals and the ability to supply credible MOVE-compliant audience data.
oOh!media
oOh!media Limited is headquartered in North Sydney and is listed on the ASX as OML. It holds the Sydney Metro and Melbourne Metro Tunnel networks, with more than 35,000 placements nationally by October 2025. Half-year revenue to June 2026 was AUD 340.9 million, with Australian revenue up 6%. In August 2026 it agreed a AUD 1.70 a share scheme with I Squared Capital, with completion expected by early December 2026.
JCDecaux Australia
JCDecaux Australia and New Zealand is part of Paris-headquartered JCDecaux, led by co-chief executives David Watkins and Max Eburne. It is the exclusive media partner across Sydney Airport's terminals, where it launched three large-format sites in July 2025. In March 2026 it retained Yarra Trams for up to 14 years, and in April 2026 it won Western Sydney International Airport.
QMS Media
QMS Media is headquartered in North Sydney and sells digital out-of-home media across Australia and New Zealand. In March 2026 it agreed to represent Australian Outdoor Media's assets, covering 24 digital faces and three premium static sites in New South Wales, Victoria, Queensland and South Australia. From 1 October 2025 it absorbed MediaWorks' New Zealand outdoor unit, and it holds the City of Sydney street furniture concession.
Val Morgan Outdoor
Val Morgan Outdoor, known as VMO, is part of the Sydney-based Val Morgan Group, owned by The HOYTS Group. It runs digital screens in shopping centres, health clubs and office towers. In June 2026 it reported 550 retail locations, more than 100 sites added in 18 months and AUD 15 million of capital expenditure, with renewals at Central Park Mall, Meriton Retail Precincts, Region Group and TOGA.
Other players operating in the Australia OOH and DOOH market include Australian Outdoor Media, OA Collective, Hyped Media, Big Rig Media, and Gipps Outdoor, alongside programmatic platforms, council and transport authorities, measurement providers and digital sign suppliers supporting media owners across Australia.
Competition turns on securing long transport concessions, funding digital conversion and supplying trusted audience data rather than price, favouring operators with scale, capital and strong relationships with planners.


Upto 15% Off
AUD
$2749 $2499
$3849 $3499
$4949 $4499
$6049 $5499


*While we strive to always give you current and accurate information, the numbers depicted on the website are indicative and may differ from the actual numbers in the main report. At Expert Market Research, we aim to bring you the latest insights and trends in the market. Using our analyses and forecasts, stakeholders can understand the market dynamics, navigate challenges, and capitalize on opportunities to make data-driven strategic decisions.*
The Australia OOH and DOOH market is valued at AUD 1.50 billion in 2025, supported by digital conversion, new rail and airport concessions, MOVE measurement and the early rise of programmatic buying, with New South Wales as the largest base.
The market is forecast to reach AUD 2.79 billion by 2035, growing at a CAGR of 6.40 % over the 2026 to 2035 period, driven by transport network expansion, mobile and immersive formats and programmatic trading that lets buyers purchase outdoor alongside other digital media.
Rail, Metro and Transit records the highest CAGR at an estimated 8.4% through 2035, as Sydney Metro, the Melbourne Metro Tunnel and Yarra Trams give media owners large digital networks with captive commuter audiences.
New South Wales dominates, supported by Sydney Metro, Sydney Airport and council small format contracts. Queensland is the fastest-growing region at an estimated 7.2% CAGR, helped by new digital sites in Brisbane.
Key players include oOh!media, JCDecaux Australia, QMS Media, Val Morgan Outdoor, Australian Outdoor Media, OA Collective, Hyped Media, Big Rig Media, and Gipps Outdoor.
It is the automated buying of digital out-of-home screens through platforms, using data and time triggers. JCDecaux said in September 2025 that programmatic trades about 8% of Australian digital outdoor revenue.
MOVE is the Outdoor Media Association's audience measurement system, which layers mobility and behavioural data. It launched on 9 March 2026 and became the sole industry currency on 16 March 2026.
Explore our key highlights of the report and gain a concise overview of key findings, trends, and actionable insights that will empower your strategic decisions.
| REPORT FEATURES | DETAILS |
| Base Year | 2025 |
| Historical Period | 2019-2025 |
| Forecast Period | 2026-2035 |
| Scope of the Report |
Historical and Forecast Trends, Industry Drivers and Constraints, Historical and Forecast Market Analysis by Segment:
|
| Breakup by Media Format |
|
| Breakup by Display Technology |
|
| Breakup by Trading Method |
|
| Breakup by Region |
|
| Market Dynamics |
|
| Competitive Landscape |
|
| Companies Covered |
|
Datasheet
AUD 2,749
AUD 2,499
tax inclusive*
Single User License
AUD 3,849
AUD 3,499
tax inclusive*
Five User License
AUD 4,949
AUD 4,499
tax inclusive*
Corporate License
AUD 6,049
AUD 5,499
tax inclusive*
*Please note that the prices mentioned below are starting prices for each bundle type. Kindly contact our team for further details.*
Flash Bundle
Small Business Bundle
Growth Bundle
Enterprise Bundle
*Please note that the prices mentioned below are starting prices for each bundle type. Kindly contact our team for further details.*
Flash Bundle
Number of Reports: 3
20%
tax inclusive*
Small Business Bundle
Number of Reports: 5
25%
tax inclusive*
Growth Bundle
Number of Reports: 8
30%
tax inclusive*
Enterprise Bundle
Number of Reports: 10
35%
tax inclusive*
How To Order

Select License Type
Choose the right license for your needs and access rights.

Click on ‘Buy Now’
Add the report to your cart with one click and proceed to register.

Select Mode of Payment
Choose a payment option for a secure checkout. You will be redirected accordingly.
Strategic Solutions for Informed Decision-Making
Stay upgraded and grab opportunities by strategic insights
Stay informed and aware for a Market Leverage
Analyze pricing patterns with comprehensive trend analyses.
Analyse trade data for supply chain insights.
Leverage cost reports for smart savings
Elevate supply chain with collaboration
Contact Us for Further Information
Our specialized analysts will be available to answer all the pre-purchase and post-purchase queries regarding the report.
Our specialized analysts will be available to answer all the pre-purchase and post-purchase queries regarding the report.
Staying one step ahead of the market landscape with our in-depth research methods, integrating advanced analytics to drive precise and tangible outcomes.
Our expert analyst team offers a significant advantage over competitors, with extensive market insights into the latest trends, putting you strategically ahead.
We deliver a simplified yet extensive report, comprising in-depth industry insights and analytics tailored to your industry requirements.
We are happy to help you navigate through the services we offer and solve your queries.
Contact us