Consumer Insights
Uncover trends and behaviors shaping consumer choices today
Procurement Insights
Optimize your sourcing strategy with key market data
Industry Stats
Stay ahead with the latest trends and market analysis.
The Australia rooftop solar market covers the supply and installation of rooftop photovoltaic systems on homes, businesses, farms and industrial buildings, including panels, inverters, mounting hardware, wiring, monitoring and installation labour. Systems are sized from a few kilowatts on suburban roofs to several hundred kilowatts on warehouses, and are sold net of small-scale certificate discounts.
In 2025, the market is valued at AUD 2.95 billion and is forecast to grow at a CAGR of 5.00%, reaching AUD 4.81 billion by 2035. Growth is driven by high household electricity prices, battery rebates that pull solar sales forward, and a federal scheme expansion that opens commercial systems up to one megawatt.
Compound Annual Growth Rate
5%
Value in AUD billion
2026-2035
The Australia rooftop solar market is in a record-setting phase. Installations dipped in 2025 as households waited for battery rebates, then rebounded sharply in 2026, with the strongest half-year capacity ever recorded and larger systems paired with storage.
Three forces shape the outlook: federal incentives that now reward batteries and commercial systems, a shift from string inverters to hybrid and microinverter designs, and state programs that tighten eligibility as uptake matures and replacement demand grows.
In February 2026 the Clean Energy Council reported 2.6 GW added in 2025, in August 2026 the government announced eligibility up to 1 MW from October, and in September 2026 the council reported 1,894 MW installed in the first half.
The market is moving from small string-inverter systems sold on payback towards larger, battery-ready installations sold on self-consumption and backup. Residential systems up to 10 kW and string inverters still lead because most roofs and installer skills are built around them, while the 100 kW to 1 MW band, industrial and agricultural users and hybrid inverters advance fastest as eligibility widens. New South Wales remains the largest base, and Queensland grows quickest from a comparably large one. Rebate design, network approvals and replacement of ageing systems support a durable multi-year outlook rather than a one-off surge tied to a single incentive.
| Metric | Value |
| Market Size 2025 | AUD 2.95 billion |
| Projected Market Size 2035 | AUD 4.81 billion |
| CAGR 2026 to 2035 | 5.00% |
| Fastest-Growing End User | Industrial and Agricultural: 9.4% CAGR |
| Fastest-Growing System Size | 100 kW to 1 MW: 10.2% CAGR |
| Largest Revenue Segment 2025 | Residential |
| Dominant Region | New South Wales |
| Highest CAGR by Region | Queensland: 5.8% |
| Rooftop solar installed, first half of 2026 | 1,894 MW |
Eligibility Changes Reshape Demand
Revenue is set to rise from AUD 2.95 billion in 2025 to AUD 4.81 billion in 2035 at a 5.0% CAGR, as scheme changes and replacement demand offset falling hardware prices.
Large Systems and Hybrid Inverters Lead Growth
Residential systems remain the largest segment, but systems of 100 kW to 1 MW grow at an estimated 10.2% CAGR and hybrid inverters at 8.3% through 2035, driven by commercial eligibility and battery attachment.
Commercial Buyers Gain Most From the 1 MW Rule
The expanded scheme gives industrial, agricultural and commercial buyers an upfront discount, which the government illustrated with two example system sizes.
| Report Summary | Unit | Value |
| Base Year | AUD billion | 2025 |
| Historical Period | AUD billion | 2019 to 2025 |
| Forecast Period | AUD billion | 2026 to 2035 |
| Market Size 2025 | AUD billion | 2.95 |
| Market Size 2035 | AUD billion | 4.81 |
| CAGR 2026 to 2035 | Percentage | 5.00 % |
| CAGR by End User: Industrial and Agricultural | Percentage | 9.4 % |
| CAGR by System Size: 100 kW to 1 MW | Percentage | 10.2 % |
| CAGR by Inverter Type: Hybrid Inverters | Percentage | 8.3 % |
| CAGR by Region: Queensland | Percentage | 5.8 % |
| Rooftop Solar Capacity Installed, First Half of 2026 | Megawatts | 1,894 |
| Rooftop Solar Systems Installed, First Half of 2026 | Systems | 180,878 |
| Market Share by Region 2025 | New South Wales | Dominant Share |
Incentive design, high power prices and battery pairing shape demand. Larger commercial systems and hybrid inverters expand fastest while residential string-inverter installations remain the largest base.
The Australia rooftop solar market is being reshaped by record installation volumes, battery-linked incentives, commercial scheme expansion and tighter state eligibility.
September 2026 - Clean Energy Council Reports Record Half-Year
August 2026 - Government Extends Small-Scale Scheme to 1 MW
July 2026 - Victoria Lowers Solar Homes Income Cap
May 2026 - Battery Rebate Changes Alter Solar Sales Mix
Policy is shifting from household panels towards storage-linked and larger commercial systems, while states narrow eligibility as uptake matures and installers adapt to changing certificate and rebate settings.
Recent developments, presented from the most recent, show the Australia rooftop solar market moving from record regulator data and distributor deals into new product launches.
August 2026 - Clean Energy Regulator Confirms Record Quarter
June 2026 - Fox ESS and Solar Juice Sign Storage Agreement
May 2026 - GoodWe Appoints Solar Juice as Distributor
March 2026 - Enphase Launches IQ Energy Management
Recent events show record regulator data, distributor alliances and software launches converging, giving installers firmer evidence of demand and new ways to sell storage-ready solar systems.
The Expert Market Research’s report on the Australia Rooftop Solar Market offers a detailed analysis of the market based on the following segments.
Market Breakup by End User
Residential leads because the Clean Energy Council counted 273,672 installations in 2025 and 180,878 in the first half of 2026, mostly on homes. Industrial and Agricultural grows fastest at an estimated 9.4% CAGR through 2035, because the Small-scale Renewable Energy Scheme covers systems up to 1 MW from 1 October 2026. Small Business and Commercial gains as systems of 15 to 40 kW reached 26% of installations in the June 2026 quarter, according to the Clean Energy Regulator. Others cover community halls, schools and council buildings that buy smaller systems through local programs.
Market Breakup by System Size
Up to 10 kW leads because most suburban roofs fit a system of this size, even though the average installed system reached 10.5 kW in the June 2026 quarter. 100 kW to 1 MW grows fastest at an estimated 10.2% CAGR, since the government illustrated discounts of about AUD 68,000 on a 250 kW system and AUD 232,000 on an 850 kW system in August 2026. 10 to 40 kW grows steadily as larger homes and small businesses add panels. 40 to 100 kW suits shopping centres, schools and light industry, and grows near the market average.
Market Breakup by Inverter Type
String Inverters lead because they are the lowest-cost option for unshaded roofs, and Sungrow won number one for residential inverters in May 2026 industry awards. Hybrid Inverters grow fastest at an estimated 8.3% CAGR, as over 80% of solar installs included a battery in April 2026, according to the Clean Energy Regulator. Microinverters advance as Enphase launched IQ Energy Management in March 2026, adding tariff-aware control for shaded or complex roofs. Power Optimiser Systems keep a niche in module-level monitoring and grow below the market average.
Market Breakup by Region
New South Wales dominates, with 761 MW added in 2025 and 7.96 GW installed by December 2025 according to the Clean Energy Council, and grows at an estimated 4.8% CAGR. Queensland is fastest at an estimated 5.8%, after adding 714 MW in 2025 and reaching 7.58 GW. Victoria, at 4.3%, tightened its Solar Homes income cap to AUD 150,000 in July 2026. Western Australia grows at 5.2% from 3.10 GW, while South Australia, at 4.6%, holds 2.85 GW. Others, at 5.1%, group Tasmania, the ACT and the Northern Territory, which together hold about 1.2 GW.
| CAGR 2026 to 2035, Market by Region | Growth Rate |
| New South Wales | 4.8 % |
| Queensland | 5.8 % |
| Victoria | 4.3 % |
| Western Australia | 5.2 % |
| South Australia | 4.6 % |
| Others (incl. Tasmania, ACT and Northern Territory) | 5.1 % |
Competition combines global inverter and battery makers, Australian distributors and a fragmented installer base. Barriers include listing on the Clean Energy Council approved products list, distributor relationships, installer training, firmware support and the ability to ship hybrid systems that qualify for rebates.
Sungrow
Sungrow, headquartered in Hefei, China, supplies inverters and energy storage and employs more than 100 people in Australia, including over 60 engineers and technicians. In May 2026 it was named number one for residential inverters, commercial inverters and commercial storage in industry awards based on 2025 installations. In November 2025 distributor Raystech agreed to supply 1 GWh of Sungrow batteries during 2026.
Tesla
Tesla, headquartered in Austin, Texas, sells Powerwall home batteries and solar products in Australia through its energy business and certified installers. In February 2026 Supply Partners Group signed an agreement to distribute Powerwall across Australia, with stock due that month and sales starting in mid-March 2026. Powerwall 3 is listed for the federal Cheaper Home Batteries Program, which anchors demand for solar-plus-storage households.
Enphase Energy
Enphase Energy, headquartered in Fremont, California, makes microinverters, IQ Battery systems and energy management software sold through Australian installers. On 26 March 2026 it launched IQ Energy Management in Australia and New Zealand, using the IQ Energy Router to manage variable tariffs and control third-party water heaters and electric vehicle chargers. This positions microinverter buyers to capture battery and appliance-control revenue.
Sigenergy
Sigenergy is a Shanghai-based maker of the SigenStor hybrid inverter and battery system, built on lithium iron phosphate packs of 5 kWh and 8 kWh that stack up to 48 kWh. It held 31.4% of blended battery capacity by May 2025, according to an industry tracker. In November 2025 a limited recall covered about 100 single-phase units over AC plug overheating, with free replacement offered.
Other players operating in the Australia rooftop solar market include Fronius, SolarEdge, GoodWe, Fox ESS, and Solar Juice, alongside module suppliers, state and national retailers, distributors and thousands of accredited installers supplying homes and businesses across Australia.
Competition turns on distributor access, hybrid inverter capability and installer support rather than panel price alone, favouring suppliers that pair solar with storage and software for rebate-eligible systems.


Upto 15% Off
AUD
$2749 $2499
$3849 $3499
$4949 $4499
$6049 $5499


*While we strive to always give you current and accurate information, the numbers depicted on the website are indicative and may differ from the actual numbers in the main report. At Expert Market Research, we aim to bring you the latest insights and trends in the market. Using our analyses and forecasts, stakeholders can understand the market dynamics, navigate challenges, and capitalize on opportunities to make data-driven strategic decisions.*
The Australia rooftop solar market is valued at AUD 2.95 billion in 2025, supported by high electricity prices, battery rebates that lift solar attachment and the extension of the small-scale scheme to commercial systems, with New South Wales as the largest base.
The market is forecast to reach AUD 4.81 billion by 2035, growing at a CAGR of 5.00 % over the 2026 to 2035 period, driven by commercial eligibility up to one megawatt, hybrid inverter adoption and replacement of ageing systems, partly offset by falling hardware prices and declining certificate values.
Systems of 100 kW to 1 MW record the highest CAGR at an estimated 10.2% through 2035, as the Small-scale Renewable Energy Scheme extends to 1 MW from 1 October 2026 and cuts installation costs by about 20%.
New South Wales dominates, with 761 MW added in 2025 and the largest installed base. Queensland is the fastest-growing region at an estimated 5.8% CAGR, helped by high installation volumes and large detached homes.
Key players include Sungrow, Tesla, Enphase Energy, Sigenergy, Fronius, SolarEdge, GoodWe, Fox ESS, and Solar Juice.
It is the federal scheme that gives owners of eligible solar systems tradable certificates as an upfront discount. From 1 October 2026 eligibility rises from 100 kW to 1 MW, and values decline gradually towards 2030.
The Clean Energy Council counted 153 batteries per 100 rooftop installations in the first half of 2026. Over 80% of solar installs included a battery in April, but this fell below 50% after rebate changes in May 2026.
Explore our key highlights of the report and gain a concise overview of key findings, trends, and actionable insights that will empower your strategic decisions.
| REPORT FEATURES | DETAILS |
| Base Year | 2025 |
| Historical Period | 2019-2025 |
| Forecast Period | 2026-2035 |
| Scope of the Report |
Historical and Forecast Trends, Industry Drivers and Constraints, Historical and Forecast Market Analysis by Segment:
|
| Breakup by End User |
|
| Breakup by System Size |
|
| Breakup by Inverter Type |
|
| Breakup by Region |
|
| Market Dynamics |
|
| Competitive Landscape |
|
| Companies Covered |
|
Datasheet
AUD 2,749
AUD 2,499
tax inclusive*
Single User License
AUD 3,849
AUD 3,499
tax inclusive*
Five User License
AUD 4,949
AUD 4,499
tax inclusive*
Corporate License
AUD 6,049
AUD 5,499
tax inclusive*
*Please note that the prices mentioned below are starting prices for each bundle type. Kindly contact our team for further details.*
Flash Bundle
Small Business Bundle
Growth Bundle
Enterprise Bundle
*Please note that the prices mentioned below are starting prices for each bundle type. Kindly contact our team for further details.*
Flash Bundle
Number of Reports: 3
20%
tax inclusive*
Small Business Bundle
Number of Reports: 5
25%
tax inclusive*
Growth Bundle
Number of Reports: 8
30%
tax inclusive*
Enterprise Bundle
Number of Reports: 10
35%
tax inclusive*
How To Order

Select License Type
Choose the right license for your needs and access rights.

Click on ‘Buy Now’
Add the report to your cart with one click and proceed to register.

Select Mode of Payment
Choose a payment option for a secure checkout. You will be redirected accordingly.
Strategic Solutions for Informed Decision-Making
Stay upgraded and grab opportunities by strategic insights
Stay informed and aware for a Market Leverage
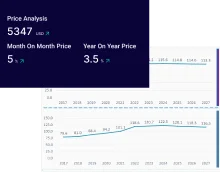
Analyze pricing patterns with comprehensive trend analyses.
Analyse trade data for supply chain insights.
Leverage cost reports for smart savings
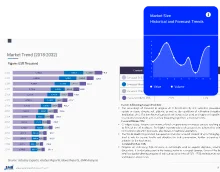
Elevate supply chain with collaboration
Contact Us for Further Information
Our specialized analysts will be available to answer all the pre-purchase and post-purchase queries regarding the report.
Our specialized analysts will be available to answer all the pre-purchase and post-purchase queries regarding the report.
Staying one step ahead of the market landscape with our in-depth research methods, integrating advanced analytics to drive precise and tangible outcomes.
Our expert analyst team offers a significant advantage over competitors, with extensive market insights into the latest trends, putting you strategically ahead.
We deliver a simplified yet extensive report, comprising in-depth industry insights and analytics tailored to your industry requirements.
We are happy to help you navigate through the services we offer and solve your queries.
Contact us