Consumer Insights
Uncover trends and behaviors shaping consumer choices today
Procurement Insights
Optimize your sourcing strategy with key market data
Industry Stats
Stay ahead with the latest trends and market analysis.
The Australia data centre rack market covers server and network racks, enclosures and cabinets, open-frame racks, rack power distribution units and the containment and liquid-cooling-ready hardware that colocation, hyperscale, enterprise and edge facilities install in their white space. Demand follows the construction of new halls in Sydney, Melbourne, Brisbane and Perth, where every hall needs thousands of racks fitted with metered power and cooling connections.
In 2025, the market is valued at AUD 270.00 million in 2025 and is forecast to grow at a (CAGR) of 14.00%, reaching AUD 1000.95 million by 2035. Growth is driven by 504 MW of approved capacity at a single Western Sydney campus, 740.1 MW of contracted utilisation at NEXTDC and the move towards liquid-cooled artificial intelligence racks.
Compound Annual Growth Rate
14%
Value in AUD million
2026-2035
The Australia data centre rack market is expanding because the country is building capacity faster than any other part of its digital infrastructure. Racks are bought hall by hall, so approvals, grid connections and customer contracts turn into orders within quarters, while rising power density changes what a rack must carry.
Three forces shape demand: a pipeline of about 6 GW, roughly four times the capacity operating at the end of 2025, according to CommBank in August 2026; power density, since air cooling handled 3 to 10 kW per rack while liquid-cooled racks now exceed 100 kW; and federal policy, which asks developers to fund renewable supply.
In March 2026 the Australian Government published its expectations of data centres and AI infrastructure developers. In August 2026 the Australian Energy Market Operator forecast consumption rising from about 5 TWh to about 34 TWh by 2035-36.
The market is moving from air-cooled server cabinets in enterprise rooms towards high-density, liquid-ready racks in large colocation and hyperscale halls. Server racks and cabinets lead in value because every hall is built around them, while rack power distribution units grow faster as metering and higher amperage become standard. Direct-to-chip liquid-ready racks advance quickest as artificial intelligence clusters replace conventional servers, and hyperscale and cloud facilities add share. New South Wales remains the largest region, and Victoria grows quickest as large Melbourne campuses reach delivery. Grid conditions, water use and local manufacturing capacity will decide how fast projects convert into orders.
| Metric | Value |
| Market Size 2025 | AUD 270.00 million |
| Projected Market Size 2035 | AUD 1000.95 million |
| CAGR 2026 to 2035 | 14.00% |
| Fastest-Growing Product Type | Rack Power Distribution Units: 16.0% CAGR |
| Fastest-Growing Cooling Method | Direct-to-Chip Liquid-Ready Racks: 26.0% CAGR |
| Largest Revenue Segment 2025 | Server Racks and Cabinets |
| Dominant Region | New South Wales |
| Highest CAGR by Region | Victoria: 15.6% |
| Contracted data centre utilisation at NEXTDC, June 2026 | 740.1 MW |
Construction Pipeline Sustains Rack Demand
Revenue is on course to expand more than threefold, from AUD 270.00 million in 2025 to AUD 1,000.95 million in 2035 at a 14.0% CAGR. Operating capacity was about 2.2 GW in early 2026, while connection requests reached 66.9 GW in June 2026.
Liquid-Ready and Intelligent Power Lead Growth
Server Racks and Cabinets hold the largest share, but Direct-to-Chip Liquid-Ready Racks grow at an estimated 26.0% CAGR and Rack Power Distribution Units at an estimated 16.0% CAGR through 2035. Schneider Electric launched its Motivair liquid cooling range in its Pacific zone in November 2025.
Grid and Policy Rules Reshape Project Timing
AEMO expects data centres to take about 13% of grid consumption by 2035-36, and the federal expectations of March 2026 ask developers to underwrite new renewable supply.
| Report Summary | Unit | Value |
| Base Year | AUD million | 2025 |
| Historical Period | AUD million | 2019 to 2025 |
| Forecast Period | AUD million | 2026 to 2035 |
| Market Size 2025 | AUD million | 270.00 |
| Market Size 2035 | AUD million | 1000.95 |
| CAGR 2026 to 2035 | Percentage | 14.00 % |
| CAGR by Product Type: Rack Power Distribution Units | Percentage | 16.0 % |
| CAGR by Cooling Method: Direct-to-Chip Liquid-Ready Racks | Percentage | 26.0 % |
| CAGR by Facility Type: Hyperscale and Cloud Data Centres | Percentage | 16.8 % |
| CAGR by Region: Victoria | Percentage | 15.6 % |
| NEXTDC Built Capacity, June 2026 | Megawatts | 287.90 |
| AirTrunk MEL2 Planned Capacity | Megawatts | 354.00 |
| Market Share by Region 2025 | New South Wales | Dominant Share |
Demand is shifting towards dense, liquid-ready racks with intelligent power distribution as large halls replace enterprise rooms. New South Wales leads, while Victoria grows fastest.
The Australia data centre rack market is being reshaped by grid forecasts, federal expectations, rising rack density and the arrival of vendor liquid cooling ranges.
August 2026 - AEMO Forecasts Data Centre Demand Rising to About 34 TWh by 2035-36
July 2026 - Vertiv Says Rack Densities Now Exceed 100 kW as Liquid Cooling Matures
March 2026 - Federal Government Publishes Expectations of Data Centres and AI Infrastructure Developers
November 2025 - Schneider Electric Launches Motivair Liquid Cooling Range in New Zealand for the Pacific Zone
Grid forecasts, federal expectations and rising rack density are the main structural forces, while connection delays and withdrawn projects remain the main risk to order timing.
Recent developments, presented from the most recent, show contracting records, new reference designs, large Melbourne campuses and a major Western Sydney approval.
August 2026 - NEXTDC Reports Contracted Utilisation of 740.1 MW at Record Annual Result
August 2026 - Trane Technologies and Eaton Unveil AI Data Centre Reference Design
January 2026 - AirTrunk Unveils Second Melbourne Campus MEL2 With More Than A$5 Billion Investment
December 2025 - New South Wales Approves CDC's A$3.1 Billion Marsden Park Campus
Record contracting, large Melbourne campuses and a Western Sydney approval show racks being ordered ahead of energisation, while integrated power and cooling designs push suppliers towards pre-configured systems.
The Expert Market Research’s report on the Australia Data Centre Rack Market offers a detailed analysis of the market based on the following segments.
Market Breakup by Product Type
Server Racks and Cabinets lead on value, in our estimate, because each new hall is built around enclosed cabinets; CDC's six-building Marsden Park campus, approved in late 2025, illustrates the scale. Rack Power Distribution Units grow fastest at an estimated 16.0% CAGR through 2035, as higher amperage and metering follow the density shift Vertiv described in July 2026. Network Racks and Cabinets track interconnection, such as NEXTDC's edge network builds in Geelong, the Sunshine Coast and Darwin reported in August 2026. Open-Frame Racks serve telecom rooms and test labs at slower growth.
Market Breakup by Cooling Method
Air-Cooled Racks lead in value today, in our estimate, because most enterprise and colocation halls still run conventional servers. Rear-Door Heat Exchanger Racks suit retrofits, with Schneider Electric's ChilledDoor handling up to 75 kW per rack as announced in November 2025. Direct-to-Chip Liquid-Ready Racks grow fastest at an estimated 26.0% CAGR through 2035, as Vertiv reported in July 2026 that racks commonly exceed 100 kW. Immersion-Ready Racks remain niche, used in research and specialist artificial intelligence deployments.
Market Breakup by Facility Type
Colocation Data Centres lead, in our estimate, with NEXTDC reporting 287.9 MW built and 740.1 MW contracted at 30 June 2026. Hyperscale and Cloud Data Centres grow fastest at an estimated 16.8% CAGR through 2035, supported by AirTrunk's MEL2 campus announced in January 2026 and CDC's approval of December 2025. Enterprise and Government Data Centres lose share as workloads move to cloud, though sovereign requirements keep demand alive. Edge and Telecom Sites grow steadily, with Vertiv noting in July 2026 that edge sites and mining operations create demand.
Market Breakup by Region
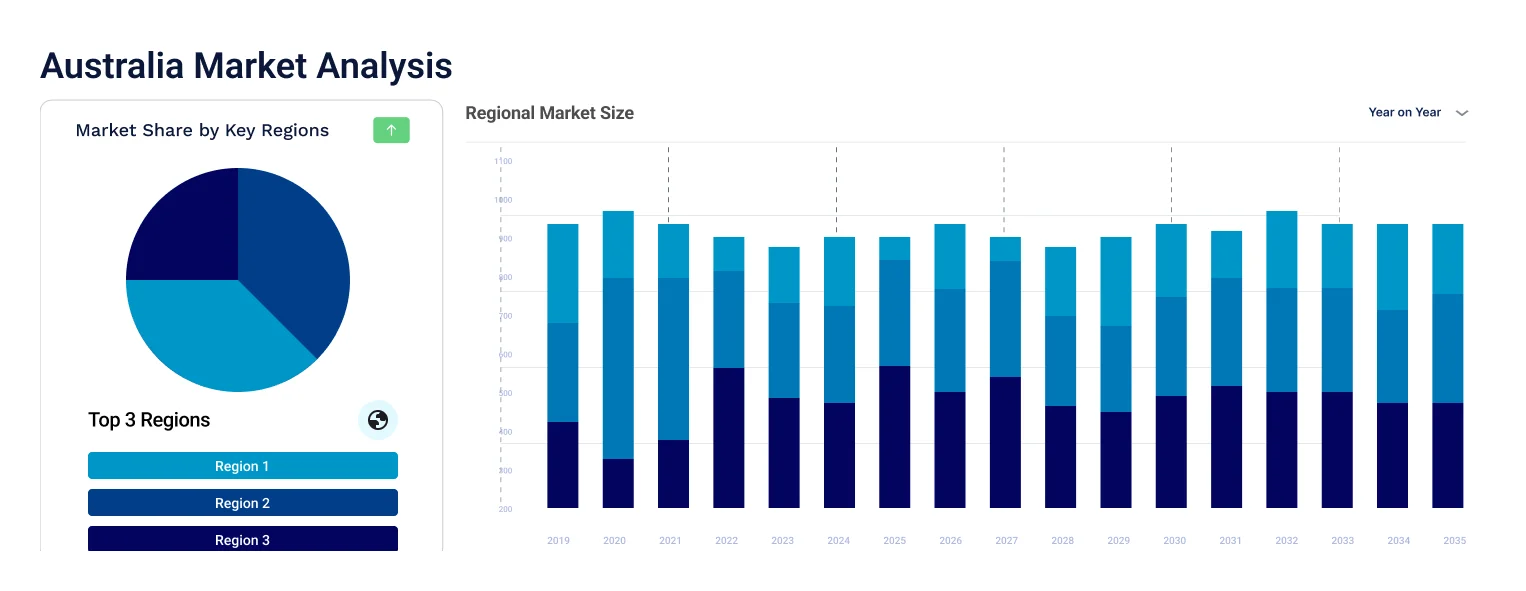
New South Wales dominates, in our estimate, as AEMO said in August 2026 that it takes about 66% of current data centre consumption, and it grows at an estimated 13.4% CAGR through 2035 from a large base. Victoria is the fastest-growing region at an estimated 15.6%, with AirTrunk MEL2 and NEXTDC's M5 site planned for up to 1.2 GW. Western Australia grows at 14.6% and Queensland at 14.2%, from small bases outside the main grid, where AEMO placed Queensland at about 1% of consumption. Others, covering South Australia, Tasmania, the Australian Capital Territory and the Northern Territory, grow at 12.8%, with Darwin an edge site.
| CAGR 2026 to 2035, Market by Region | Growth Rate |
| New South Wales | 13.4 % |
| Victoria | 15.6 % |
| Queensland | 14.2 % |
| Western Australia | 14.6 % |
| Others (incl. South Australia, Tasmania, the Australian Capital Territory and the Northern Territory) | 12.8 % |
Competition combines global power and cooling groups, rack specialists with local fabrication, and server makers selling integrated racks. Entry barriers include liquid cooling know-how, local manufacturing, channel partners and relationships with colocation and hyperscale operators.
Schneider Electric
Schneider Electric, headquartered in Rueil-Malmaison, France, sells APC racks, cabinets, rack power distribution units and EcoStruxure monitoring, alongside Motivair liquid cooling. In November 2025 its Pacific zone launched in New Zealand coolant distribution units from 105 kW to 2.5 MW and ChilledDoor rear door heat exchangers up to 75 kW per rack. In December 2025 Motivair added two new coolant distribution units, the MCDU-45 and MCDU-55, for high-density artificial intelligence halls.
Vertiv
Vertiv, headquartered in Westerville, Ohio, supplies rack power distribution units, thermal systems, coolant distribution units and prefabricated modules to Australian data centres. In May 2025 it opened a redesigned national head office at Bella Vista in Sydney with Australia's first customer experience centre. In July 2026 its ANZ head said enterprise artificial intelligence was moving into deployment, with liquid cooling now a practical purchasing issue.
Legrand
Legrand, headquartered in Limoges, France, sells racks, cabinets and rack power distribution units in Australia through Legrand ANZ. In April 2025 it acquired Computer Room Solutions, a Mascot, Sydney business with Melbourne manufacturing, about 80 staff and almost A$50 million in annual sales. The business supplies server racks, cabinets, hot and cold aisle containment, caging and ceilings, giving Legrand local white space manufacturing.
Eaton
Eaton, headquartered in Dublin, Ireland, supplies rack power distribution units, uninterruptible power systems and power distribution for data centres worldwide, including Australia. In August 2026 it and Trane Technologies unveiled a reference design for NVIDIA-based artificial intelligence sites, claiming up to 15% better energy efficiency and up to 80% less copper. The design pairs medium-voltage power with white space thermal management for high-density halls.
Other players operating in the Australia data centres rack market include Rittal, Dell Technologies, Panduit, CommScope, and Hewlett Packard Enterprise, alongside regional enclosure fabricators, power distribution distributors, system integrators and data centre construction contractors supplying racks and accessories to colocation, hyperscale, enterprise and edge facilities across Australia.
Competition rests on liquid cooling capability, local manufacturing and lead times, and channel and operator relationships rather than price alone, while acquisitions are strengthening local supply.


Upto 15% Off
AUD
$2749 $2499
$3849 $3499
$4949 $4499
$6049 $5499


*While we strive to always give you current and accurate information, the numbers depicted on the website are indicative and may differ from the actual numbers in the main report. At Expert Market Research, we aim to bring you the latest insights and trends in the market. Using our analyses and forecasts, stakeholders can understand the market dynamics, navigate challenges, and capitalize on opportunities to make data-driven strategic decisions.*
The Australia data center rack market is valued at AUD 270.00 million in 2025, supported by a large construction pipeline, contracted capacity at colocation and hyperscale operators, and the shift towards dense, liquid-ready racks, with New South Wales as the largest region.
The market is forecast to reach AUD 1000.95 million by 2035, growing at a CAGR of 14.00 % over the 2026 to 2035 period, driven by capacity additions in Sydney and Melbourne, rising rack density, federal expectations on energy use and the spread of liquid cooling.
Direct-to-Chip Liquid-Ready Racks record the highest CAGR at an estimated 26.0% through 2035, as artificial intelligence servers push rack densities beyond 100 kW and air cooling can no longer carry the load.
New South Wales dominates, as AEMO said in August 2026 that it holds about 66% of current data centre consumption. Victoria is the fastest-growing region at an estimated 15.6% CAGR, helped by large Melbourne campuses.
Key players include Schneider Electric, Vertiv, Legrand, Eaton, Rittal, Dell Technologies, Panduit, CommScope, and Hewlett Packard Enterprise.
A liquid-ready rack is a cabinet built with manifolds, load-bearing capacity and sealed connections for coolant distribution, supporting densities above 100 kW. Vertiv described such racks as common in July 2026.
The Australian Government's expectations of 23 March 2026 ask developers to fund renewable power and pay for grid connections. Projects that proceed tend to specify denser, more efficient racks, while weaker projects may be delayed.
Explore our key highlights of the report and gain a concise overview of key findings, trends, and actionable insights that will empower your strategic decisions.
| REPORT FEATURES | DETAILS |
| Base Year | 2025 |
| Historical Period | 2019-2025 |
| Forecast Period | 2026-2035 |
| Scope of the Report |
Historical and Forecast Trends, Industry Drivers and Constraints, Historical and Forecast Market Analysis by Segment:
|
| Breakup by Product Type |
|
| Breakup by Cooling Method |
|
| Breakup by Facility Type |
|
| Breakup by Region |
|
| Market Dynamics |
|
| Competitive Landscape |
|
| Companies Covered |
|
Datasheet
AUD 2,749
AUD 2,499
tax inclusive*
Single User License
AUD 3,849
AUD 3,499
tax inclusive*
Five User License
AUD 4,949
AUD 4,499
tax inclusive*
Corporate License
AUD 6,049
AUD 5,499
tax inclusive*
*Please note that the prices mentioned below are starting prices for each bundle type. Kindly contact our team for further details.*
Flash Bundle
Small Business Bundle
Growth Bundle
Enterprise Bundle
*Please note that the prices mentioned below are starting prices for each bundle type. Kindly contact our team for further details.*
Flash Bundle
Number of Reports: 3
20%
tax inclusive*
Small Business Bundle
Number of Reports: 5
25%
tax inclusive*
Growth Bundle
Number of Reports: 8
30%
tax inclusive*
Enterprise Bundle
Number of Reports: 10
35%
tax inclusive*
How To Order

Select License Type
Choose the right license for your needs and access rights.

Click on ‘Buy Now’
Add the report to your cart with one click and proceed to register.

Select Mode of Payment
Choose a payment option for a secure checkout. You will be redirected accordingly.
Strategic Solutions for Informed Decision-Making
Stay upgraded and grab opportunities by strategic insights
Stay informed and aware for a Market Leverage
Analyze pricing patterns with comprehensive trend analyses.
Analyse trade data for supply chain insights.
Leverage cost reports for smart savings
Elevate supply chain with collaboration
Contact Us for Further Information
Our specialized analysts will be available to answer all the pre-purchase and post-purchase queries regarding the report.
Our specialized analysts will be available to answer all the pre-purchase and post-purchase queries regarding the report.
Staying one step ahead of the market landscape with our in-depth research methods, integrating advanced analytics to drive precise and tangible outcomes.
Our expert analyst team offers a significant advantage over competitors, with extensive market insights into the latest trends, putting you strategically ahead.
We deliver a simplified yet extensive report, comprising in-depth industry insights and analytics tailored to your industry requirements.
We are happy to help you navigate through the services we offer and solve your queries.
Contact us