Consumer Insights
Uncover trends and behaviors shaping consumer choices today
Procurement Insights
Optimize your sourcing strategy with key market data
Industry Stats
Stay ahead with the latest trends and market analysis.
The New Zealand renewable energy market covers revenue earned from electricity generated by hydropower, geothermal, wind, solar and bioenergy plants, together with the battery storage and firming services that let that output meet demand. Sales flow through wholesale spot trading, long-term power purchase agreements, retail contracts and on-site systems at homes, farms and factories across the North and South Islands.
In 2025, the market is valued at USD 3.40 billion and is forecast to grow at a CAGR of 6.00%, reaching USD 6.09 billion by 2035. Growth is driven by renewables supplying 92% of electricity in the April to June quarter of 2026, a record solar build programme, new geothermal and wind capacity, and growing demand from electrified industry.
Compound Annual Growth Rate
6%
Value in USD billion
2026-2035
The New Zealand renewable energy market is shifting from a hydro-dominated system towards a broader portfolio. Solar farms, wind repowering, deep geothermal drilling and grid-scale batteries are being financed at pace, helped by faster consenting and a government push to lift competition and security of supply.
Three forces are shaping the market: a large pipeline of generation, with Transpower reporting 22 connection projects adding about 3,000 MW to end-2028; electrification of dairy processing, steel and transport; and reform of market rules, including time-of-use plans and fairer rates for exported rooftop solar.
In June 2026 the Environment Court gave the Waitaki Power Scheme a further 35 years of consents, and in April 2026 Contact Energy won fast-track approval for a Southland wind farm of up to 380 MW. In August 2026 Mercury approved the Puke Kapo Hau wind farm.
The market is moving from reliance on hydro lakes and gas back-up towards a mix of geothermal baseload, wind, large solar farms and batteries that smooth peaks. Hydropower leads in value because of its scale, while solar grows fastest from a small base. Industrial users and the farm and transport sector are expected to draw the most new volume as plants electrify. Hybrid solar and storage projects advance quickest, and repowering of ageing wind farms adds output without new sites. Waikato remains the largest region, and Auckland grows quickest on solar and battery builds. Faster consenting, new hedge market rules and retailer investment in generation point to a durable shift in capacity rather than a short-lived building cycle, even as dry years and connection queues test delivery.
| Metric | Value |
| Market Size 2025 | USD 3.40 billion |
| Projected Market Size 2035 | USD 6.09 billion |
| CAGR 2026 to 2035 | 6.00% |
| Fastest-Growing Technology | Solar PV: 13.5% CAGR |
| Fastest-Growing End Use | Agriculture and Transport: 8.4% CAGR |
| Largest Revenue Segment 2025 | Hydropower |
| Dominant Region | Waikato |
| Highest CAGR by Region | Auckland: 7.4% |
| Renewable share of electricity, April to June 2026 | 92% |
Retailer-Led Build Programme Lifts Revenue
Revenue is on course to expand by about 79% across the decade, from USD 3.40 billion in 2025 to USD 6.09 billion in 2035 at a 6.0% CAGR. Mercury, Contact, Genesis and Meridian each approved or financed new plants during 2026, and an equity raise of NZ$575 million by Contact in February 2026 shows investors will fund it.
Solar and Hybrid Storage Lead Growth
Hydropower holds the largest share, but Solar PV grows at an estimated 13.5% CAGR and Hybrid Solar and Storage Projects at an estimated 11.6% CAGR through 2035. Genesis took final investment decisions on two solar farms in 2026, and Contact's first 100 MW Glenbrook battery came online in March 2026.
Market Reform and Consenting Reshape Delivery
Government and regulator measures are cutting the time and risk of building generation while widening access to the power it produces. Developers now plan around approvals measured in months and rules that favour flexible supply.
| Report Summary | Unit | Value |
| Base Year | USD billion | 2025 |
| Historical Period | USD billion | 2019 to 2025 |
| Forecast Period | USD billion | 2026 to 2035 |
| Market Size 2025 | USD billion | 3.40 |
| Market Size 2035 | USD billion | 6.09 |
| CAGR 2026 to 2035 | Percentage | 6.00 % |
| CAGR by Technology: Solar PV | Percentage | 13.5 % |
| CAGR by End Use: Agriculture and Transport | Percentage | 8.4 % |
| CAGR by Project Type: Hybrid Solar and Storage Projects | Percentage | 11.6 % |
| CAGR by Region: Auckland | Percentage | 7.4 % |
| Solar Generation April to June 2026 | Gigawatt Hours | 242 |
| Geothermal Generation April to June 2026 | Gigawatt Hours | 2621 |
| Market Share by Region 2025 | Waikato | Dominant Share |
Renewables supply most electricity, and growth now comes from solar, storage, wind repowering and geothermal additions. Waikato leads on scale, while Auckland grows fastest on solar and batteries.
The New Zealand renewable energy market is being reshaped by record renewable shares, rapid solar growth, faster approvals and market rule changes aimed at flexibility and competition.
September 2026 - MBIE Reports Record Solar Output and 92% Renewable Share
July 2026 - Tauhei Becomes New Zealand's Largest Operating Solar Plant
May 2026 - Electricity Authority Announces Time-of-Use and Solar Export Reforms
April 2026 - Southland Wind Farm Wins Fast-Track Approval for Up to 380 MW
Record renewable shares, rapid solar growth, faster consenting and retail reforms are the main structural forces, while grid connection delays and dry years remain the main risks to delivery.
Recent developments, presented from the most recent, show new wind approvals, hydro consent certainty, battery commissioning and geothermal capacity entering service.
August 2026 - Mercury Approves NZ$506 Million Puke Kapo Hau Wind Farm
June 2026 - Waitaki Power Scheme Gains 35 Years of Consents
March 2026 - Contact Brings First 100 MW Glenbrook Battery Online
January 2026 - Mercury's New Ngā Tamariki Geothermal Unit Starts Generating
Wind approvals, hydro consent certainty, grid-scale batteries and new geothermal capacity show generators committing capital to firm and flexible supply through the forecast period.
The Expert Market Research’s report on the New Zealand Renewable Energy Market offers a detailed analysis of the market based on the following segments.
Market Breakup by Technology
Hydropower leads on value, in our estimate, with hydro output of 6,283 GWh in the April to June 2026 quarter and Meridian's Waitaki consents secured in June 2026. Geothermal is a firm second after a record 2,621 GWh that quarter and Mercury's new Ngā Tamariki unit in January 2026. Wind Power grows steadily as Mercury approved Puke Kapo Hau in August 2026. Solar PV grows fastest at an estimated 13.5% CAGR through 2035, as Tauhei was energised in July 2026. Bioenergy and Others cover wood waste, biogas and landfill gas plants.
Market Breakup by End Use
Industrial leads in value, in our estimate, with Contact signing an 11-year, 50 MW supply agreement with NZ Steel in August 2025. Residential demand is supported by Genesis, whose EV plan customers rose 43% to about 17,000 in 2026, and by rooftop solar reforms announced in May 2026. Commercial demand includes data centres, with Mercury's 140 MW Datagrid option of March 2026. Agriculture and Transport grows fastest at an estimated 8.4% CAGR through 2035, with Mercury's Fonterra hot water programme reaching 50,000 cylinders.
Market Breakup by Project Type
Utility-Scale Grid Projects lead, in our estimate, led by Genesis, which acquired the 271 MWp Rangiriri solar farm and gained fast-track approval for the 220 MWp Foxton farm in 2026. Distributed and Rooftop Systems grow with Lodestone's July 2026 financing of a 31.5 MWdc Central Hawke's Bay farm. Hybrid Solar and Storage Projects grow fastest at an estimated 11.6% CAGR through 2035, as Glorit combines 150 MW of solar with a 100 MW battery. Repowering and Upgrades include Meridian's Te Rere Hau decision targeted for 2026.
Market Breakup by Region
Waikato dominates, in our estimate, through its hydro chain, geothermal fields near Taupō and the Tauhei solar plant, and grows at an estimated 5.3% CAGR through 2035 from a mature base. Auckland is the fastest-growing region at an estimated 7.4%, with the Glenbrook batteries and Glorit solar farm. Canterbury grows at 6.5%, supported by Waitaki consents and Christchurch Airport's Kōwhai Park solar plant. Wellington grows at 5.6%, with Meridian's Mt Munro wind decision in Wairarapa due in 2026, and Others, covering Southland and Otago wind and hydro, at 6.0%.
| CAGR 2026 to 2035, Market by Region | Growth Rate |
| Auckland | 7.4 % |
| Wellington | 5.6 % |
| Canterbury | 6.5 % |
| Waikato | 5.3 % |
| Others (incl. Otago, Southland, Northland, Taranaki, Hawke's Bay and Manawatū) | 6.0 % |
Competition combines four large generator-retailers with solar developers, geothermal owners and international investors. Entry barriers include consenting, grid connection through Transpower, hedge market access, land and landowner agreements, and the capital needed for multi-year builds.
Meridian Energy
Meridian Energy, headquartered in Wellington, is New Zealand's largest renewable generator, with hydro stations on the Waitaki and Waiau schemes plus wind farms and solar projects. Its half-year result of 25 February 2026 showed record wind generation, an operating Ruakākā battery and Ruakākā solar due to deliver first power in November 2026. In June 2026 the Environment Court approved the Waitaki scheme for 35 more years.
Contact Energy
Contact Energy, headquartered in Wellington, generates from geothermal, hydro, wind and flexible thermal plants and serves more than 690,000 retail connections. It completed the Manawa Energy acquisition in July 2025, raised NZ$575 million of equity in February 2026 and won Southland Wind Farm consent in April 2026. Its August 2026 result reported 98% renewable output and Te Mihi Stage 2 geothermal due in the third quarter of 2027.
Mercury NZ
Mercury NZ, headquartered in Auckland, owns hydro stations on the Waikato River, geothermal plants and a growing wind portfolio. Its result of 18 August 2026 reported an operating earnings rise of 36% to NZ$1,068 million and NZ$710 million reinvested in renewable assets. Ngā Tamariki came online in January 2026, Kaiwaikawe generated in July 2026 and the NZ$506 million Puke Kapo Hau wind farm was approved in August 2026.
Genesis Energy
Genesis Energy, headquartered in Auckland, runs the Huntly power station, the Tongariro hydro scheme and a fast-growing solar and battery pipeline. Its result of 26 August 2026 reported solar construction decisions on Tihori and Leeston, the Rangiriri acquisition and fast-track approval for Foxton. The first 100 MW Huntly battery is due to be fully operational by September 2026, and a Yinson Renewables partnership covers more than 1 GW of onshore wind.
Other players operating in the New Zealand renewable energy market include Nova Energy, Lightsource bp, Lodestone Energy, Yinson Renewables, and Top Energy, alongside community and iwi-owned geothermal operators, regional lines companies, rooftop solar installers and commercial energy service providers supplying clean power across the North and South Islands.
Competition rests on consenting speed, grid access, hedge market position and project finance strength rather than price alone, while retailer ownership of generation keeps the market concentrated.


Upto 15% Off
AUD
$2749 $2499
$3849 $3499
$4949 $4499
$6049 $5499


*While we strive to always give you current and accurate information, the numbers depicted on the website are indicative and may differ from the actual numbers in the main report. At Expert Market Research, we aim to bring you the latest insights and trends in the market. Using our analyses and forecasts, stakeholders can understand the market dynamics, navigate challenges, and capitalize on opportunities to make data-driven strategic decisions.*
The New Zealand renewable energy market is valued at USD 3.40 billion in 2025, supported by a renewable share of 92% in the April to June quarter of 2026, a record solar build programme, new geothermal and wind capacity and growing electrification of industry, with Waikato as the largest region.
The market is forecast to reach USD 6.09 billion by 2035, growing at a CAGR of 6.00 % over the 2026 to 2035 period, driven by faster fast-track consenting, retailer-led investment in solar, wind and batteries, and market reforms that reward flexible and distributed supply.
Solar PV records the highest CAGR at an estimated 13.5% through 2035, as large farms such as Tauhei, Rangiriri and Glorit are built and solar output rose 56.2% in the April to June 2026 quarter.
Waikato dominates, through its Waikato River hydro stations, Taupō geothermal fields and the Tauhei solar plant. Auckland is the fastest-growing region at an estimated 7.4% CAGR, helped by battery and solar projects.
Key players include Meridian Energy, Contact Energy, Mercury NZ, Genesis Energy, Nova Energy, Lightsource bp, Lodestone Energy, Yinson Renewables, and Top Energy.
The Waitaki Power Scheme is Meridian's chain of six hydro stations with 1,553 MW of capacity. In June 2026 the Environment Court approved its operation for another 35 years.
Batteries store midday solar and wind output for evening peaks. Contact's first 100 MW Glenbrook unit came online in March 2026, and Genesis was commissioning its 100 MW Huntly battery in August 2026.
Explore our key highlights of the report and gain a concise overview of key findings, trends, and actionable insights that will empower your strategic decisions.
| REPORT FEATURES | DETAILS |
| Base Year | 2025 |
| Historical Period | 2019-2025 |
| Forecast Period | 2026-2035 |
| Scope of the Report |
Historical and Forecast Trends, Industry Drivers and Constraints, Historical and Forecast Market Analysis by Segment:
|
| Breakup by Technology |
|
| Breakup by End Use |
|
| Breakup by Project Type |
|
| Breakup by Region |
|
| Market Dynamics |
|
| Competitive Landscape |
|
| Companies Covered |
|
Datasheet
AUD 2,749
AUD 2,499
tax inclusive*
Single User License
AUD 3,849
AUD 3,499
tax inclusive*
Five User License
AUD 4,949
AUD 4,499
tax inclusive*
Corporate License
AUD 6,049
AUD 5,499
tax inclusive*
*Please note that the prices mentioned below are starting prices for each bundle type. Kindly contact our team for further details.*
Flash Bundle
Small Business Bundle
Growth Bundle
Enterprise Bundle
*Please note that the prices mentioned below are starting prices for each bundle type. Kindly contact our team for further details.*
Flash Bundle
Number of Reports: 3
20%
tax inclusive*
Small Business Bundle
Number of Reports: 5
25%
tax inclusive*
Growth Bundle
Number of Reports: 8
30%
tax inclusive*
Enterprise Bundle
Number of Reports: 10
35%
tax inclusive*
How To Order

Select License Type
Choose the right license for your needs and access rights.

Click on ‘Buy Now’
Add the report to your cart with one click and proceed to register.

Select Mode of Payment
Choose a payment option for a secure checkout. You will be redirected accordingly.
Strategic Solutions for Informed Decision-Making
Stay upgraded and grab opportunities by strategic insights
Stay informed and aware for a Market Leverage
Analyze pricing patterns with comprehensive trend analyses.
Analyse trade data for supply chain insights.
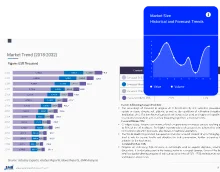
Leverage cost reports for smart savings
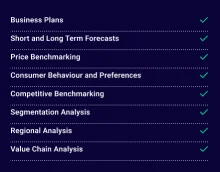
Elevate supply chain with collaboration
Contact Us for Further Information
Our specialized analysts will be available to answer all the pre-purchase and post-purchase queries regarding the report.
Our specialized analysts will be available to answer all the pre-purchase and post-purchase queries regarding the report.
Staying one step ahead of the market landscape with our in-depth research methods, integrating advanced analytics to drive precise and tangible outcomes.
Our expert analyst team offers a significant advantage over competitors, with extensive market insights into the latest trends, putting you strategically ahead.
We deliver a simplified yet extensive report, comprising in-depth industry insights and analytics tailored to your industry requirements.
We are happy to help you navigate through the services we offer and solve your queries.
Contact us