Consumer Insights
Uncover trends and behaviors shaping consumer choices today
Procurement Insights
Optimize your sourcing strategy with key market data
Industry Stats
Stay ahead with the latest trends and market analysis.
The Australia telecom tower market covers the revenue earned from leasing, building and maintaining the towers, monopoles, rooftop sites, small cells and distributed antenna systems that carry mobile radio equipment for network operators. Tenancy fees, build-to-suit construction, site upgrades, power and backhaul services each contribute to spending across macro, rooftop and street-level infrastructure.
In 2025, the market is valued at AUD 1850.00 million and is forecast to grow at a CAGR of 5.40%, reaching AUD 3130.24 million by 2035. Growth is driven by next-generation mobile densification, government co-funded regional coverage, operators selling towers to specialist owners and demand for resilient sites that can host satellite and fixed wireless services.
Compound Annual Growth Rate
5.4%
Value in AUD million
2026-2035
The Australia telecom tower market is moving from a phase of asset sales to one of shared growth. Three national operators now rent most of their sites from specialist owners, and the focus has shifted to adding tenants, upgrading radios and reaching places where a standalone site cannot be justified.
Three forces shape the market: regional network sharing between Optus and TPG Telecom that lets two operators use one tower; government programs that co-fund new regional sites; and satellite-to-phone services that change where terrestrial coverage is needed.
In September 2025 Optus agreed to sell 340 towers and rooftops to Waveconn, in March 2026 the Mobile Black Spot Program announced its Round 8 outcomes, and in August 2026 Telstra reported another year of growth in its Amplitel tower business.
The market is moving from single-operator sites towards shared, multi-tenant infrastructure that can be upgraded without new construction. Macro towers and monopoles still lead because most coverage and capacity sits on them, while small cells, neutral host builds and fixed wireless services advance fastest as operators densify cities and fill regional gaps. New South Wales remains the largest base, and Queensland grows quickest from a smaller one as co-funded programs and major event preparation add sites. Network sharing, tower sales, satellite partnerships and coverage-map rules point to a durable, multi-year outlook in which owners compete on tenancy and speed of delivery rather than on a one-off construction boom.
| Metric | Value |
| Market Size 2025 | AUD 1850.00 million |
| Projected Market Size 2035 | AUD 3130.24 million |
| CAGR 2026 to 2035 | 5.40% |
| Fastest-Growing Infrastructure Type | Small Cells and Distributed Antenna Systems: 9.3% CAGR |
| Fastest-Growing Ownership Model | Neutral Host and Build-to-Suit Providers: 7.6% CAGR |
| Largest Revenue Segment 2025 | Macro Towers and Monopoles |
| Dominant Region | New South Wales |
| Highest CAGR by Region | Queensland: 6.6% |
| Mobile Black Spot base stations activated, April 2026 | 1,202 |
Shared Infrastructure Sustains Steady Growth
Revenue is set to rise from AUD 1,850.00 million in 2025 to AUD 3,130.24 million in 2035 at a 5.4% CAGR, as tenancy growth and radio upgrades lift income from existing sites.
Small Cells and Neutral Hosts Lead Growth
Macro towers remain the largest segment, but small cells and distributed antenna systems grow at an estimated 9.3% CAGR and neutral host builders at 7.6% through 2035, driven by urban densification.
Co-Funding and Satellite Services Reshape Rural Sites
Government programs and satellite messaging both influence where operators place new regional structures, and tower owners are bidding for the work directly.
| Report Summary | Unit | Value |
| Base Year | AUD million | 2025 |
| Historical Period | AUD million | 2019 to 2025 |
| Forecast Period | AUD million | 2026 to 2035 |
| Market Size 2025 | AUD million | 1850.00 |
| Market Size 2035 | AUD million | 3130.24 |
| CAGR 2026 to 2035 | Percentage | 5.40 % |
| CAGR by Infrastructure Type: Small Cells and Distributed Antenna Systems | Percentage | 9.3 % |
| CAGR by Ownership Model: Neutral Host and Build-to-Suit Providers | Percentage | 7.6 % |
| CAGR by Application: Fixed Wireless and Enterprise Networks | Percentage | 8.4 % |
| CAGR by Region: Queensland | Percentage | 6.6 % |
| Mobile Black Spot Base Stations Activated, April 2026 | Number | 1,202 |
| Mobile Black Spot Round 8 Projects, March 2026 | Number | 17 |
| Market Share by Region 2025 | New South Wales | Dominant Share |
Tower sales to specialist owners, shared regional networks and government co-funding shape demand. Small cells and neutral host builds advance fastest while macro towers remain the dominant revenue base.
The Australia telecom tower market is being reshaped by satellite-to-phone services, new coverage-map rules, regional road programs and the continued sale of operator-owned sites to specialist owners.
August 2026 - Telstra Reports Network Investment and Amplitel Growth
July 2026 - Telstra Extends Satellite Services and Regional Roads Funding Arrives
June 2026 - ACMA Coverage-Map Rules Take Effect
May 2026 - West Coast Tasmania Capacity Round Moves to Consultation
Satellite messaging, standardised coverage maps and regional road funding are changing where operators place new sites, pushing tower owners towards multi-tenant builds and upgrades rather than one-off construction.
Recent developments, presented from the most recent, show the Australia telecom tower market moving from operator asset sales and radio upgrades into co-funded builds and wider network sharing.
March 2026 - Mobile Black Spot Program Announces Round 8 Outcomes
November 2025 - Universal Outdoor Mobile Obligation Bill Introduced
October 2025 - Waveconn Details Optus Tower Acquisition
May 2025 - Nokia Upgrades Optus Regional 5G Sites
Recent events show co-funded regional builds, operator tower sales and radio upgrades converging, giving owners firmer evidence of tenancy demand and a clearer pipeline of new sites.
The Expert Market Research’s report on the Australia Telecom Tower Market offers a detailed analysis of the market based on the following segments.
Market Breakup by Infrastructure Type
Macro Towers and Monopoles lead because Telstra's Amplitel, Indara and Waveconn portfolios are built around them, and Telstra added more than 150 new sites in the year to June 2026. Small Cells and Distributed Antenna Systems grow fastest at an estimated 9.3% CAGR through 2035, as operators densify cities and Ericsson extended its Optus antenna system supply in June 2025. Rooftop Sites are a steady urban segment, shown by Optus including rooftops in its September 2025 sale of 340 sites to Waveconn. Others cover temporary cells-on-wheels, utility poles and broadcast mast sharing.
Market Breakup by Ownership Model
Tower Companies lead because Amplitel earned AUD 391 million before interest, tax, depreciation and amortisation in the year to June 2026, and Indara and Waveconn hold large portfolios. Neutral Host and Build-to-Suit Providers grow fastest at an estimated 7.6% CAGR, as Waveconn's September 2025 Optus purchase shows demand for outsourced construction. Mobile Network Operator-Owned Sites shrink in share as operators sell, though TPG Telecom still gains access to 2,444 Optus sites through sharing. Government Co-Funded Sites expand through the Mobile Black Spot Program, whose Round 8 funded 17 projects in March 2026.
Market Breakup by Application
Urban Densification and Capacity leads because Nokia and Ericsson upgrades in 2025 were aimed at capacity, energy efficiency and indoor coverage. Fixed Wireless and Enterprise Networks grow fastest at an estimated 8.4% CAGR, as operators use spare radio capacity and private network demand lifts tenancy on existing sites. Regional and Remote Coverage grows steadily, supported by the AUD 30 million regional roads program outlined in July 2026. Disaster Resilience and Public Safety is a smaller niche, with Round 8 explicitly targeting areas prone to bushfires, storms and floods, and growing as batteries and backup power are added.
Market Breakup by Region
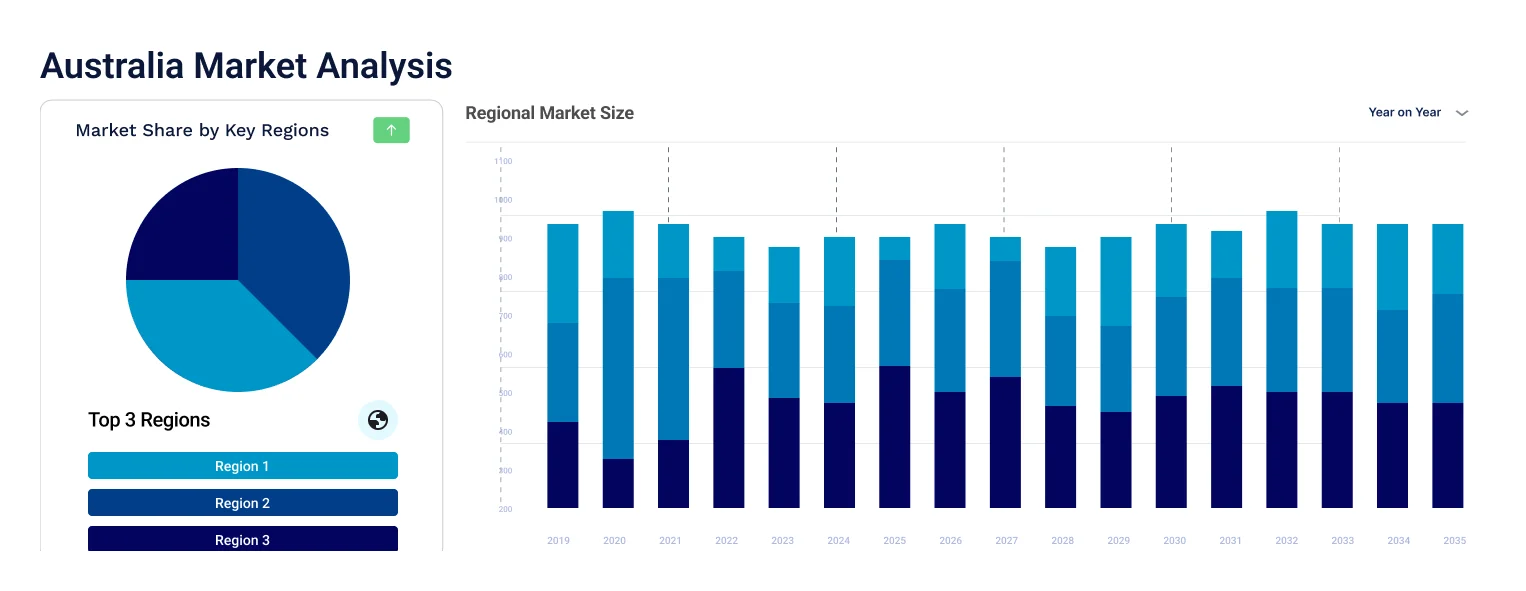
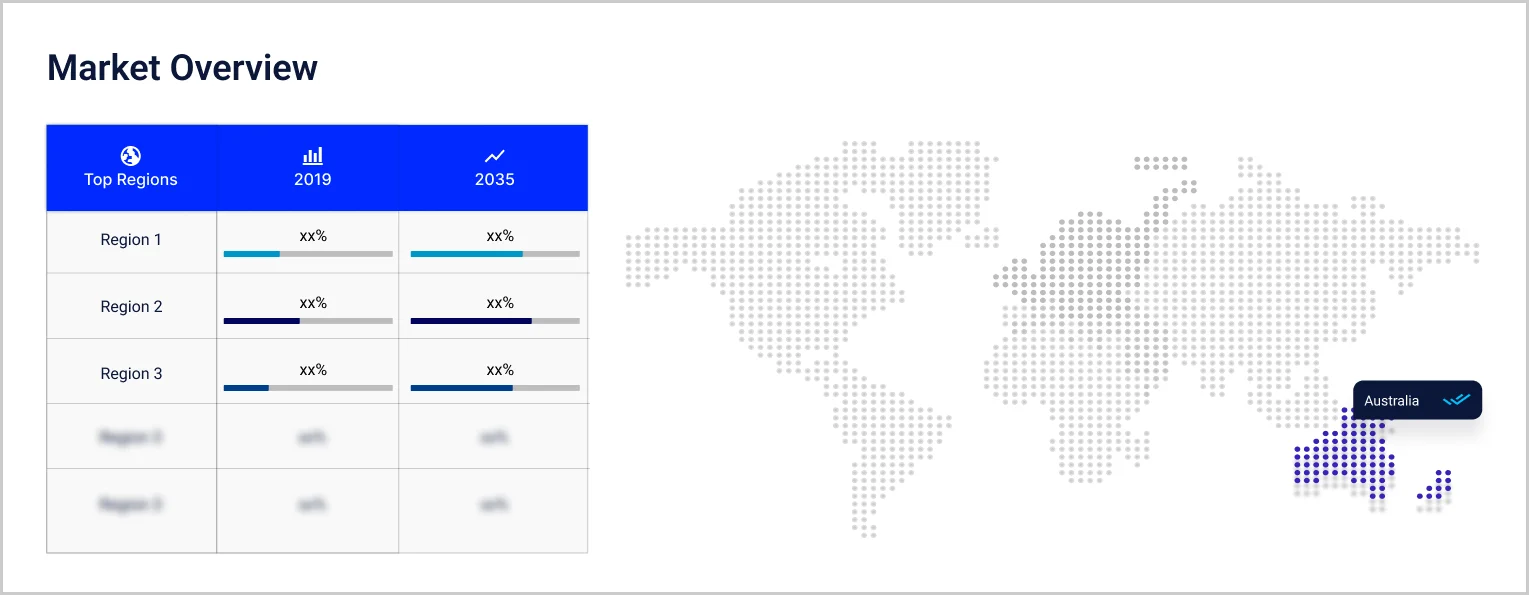
New South Wales dominates, receiving 10 of the 17 sites funded in Round 8 in March 2026, and grows at an estimated 5.0% CAGR from a mature base. Queensland is fastest at an estimated 6.6%, with three Round 8 sites and expanding regional road coverage. Western Australia grows at 6.1% from long regional distances, South Australia at 5.6% with three Round 8 sites, and Victoria at 5.2% from a dense, well-covered base. Others, grouping Tasmania, the ACT and the Northern Territory, grows at 5.5%, helped by the West Coast Tasmania round that went to consultation in May 2026.
| CAGR 2026 to 2035, Market by Region | Growth Rate |
| New South Wales | 5.0 % |
| Victoria | 5.2 % |
| Queensland | 6.6 % |
| Western Australia | 6.1 % |
| South Australia | 5.6 % |
| Others (incl. Tasmania, ACT and Northern Territory) | 5.5 % |
Competition combines specialist tower owners, mobile operators that retain sites, global radio suppliers and infrastructure builders. Entry barriers include existing tenancy contracts, planning approvals, access to regional land and power, and the ability to deliver upgrades quickly for several operators.
Amplitel
Amplitel is Telstra's tower business, with Telstra retaining 51%, and is based in Sydney. It owns more than 8,000 towers, masts and poles, making it one of the largest tower owners in Australia. Telstra reported in August 2026 that Amplitel earnings rose 9% to AUD 391 million, and that Telstra built more than 150 new sites in the year to June 2026.
Indara
Indara is a Sydney-based digital infrastructure company backed by AustralianSuper and Singtel, formed from the former Australian Tower Network. It owns and operates towers, rooftops and small cells, and provides street-level infrastructure. In March 2026 it was named as an applicant on most Round 8 Mobile Black Spot sites, where Optus and TPG Telecom are the main carriers.
Optus
Optus is headquartered in Sydney and is owned by Singtel. It sold about 340 towers and rooftop sites to Waveconn in September 2025 and keeps ownership of its active network equipment. In January 2025 it began regional network sharing with TPG Telecom, and in May 2025 Nokia announced a regional 5G upgrade on its sites, followed by an Ericsson antenna agreement in June 2025.
Ericsson
Ericsson is headquartered in Stockholm and supplies radio access networks and antenna systems to operators worldwide, including in Australia. In June 2025 it extended its partnership with Optus to deploy Ericsson antenna system solutions that improve coverage, capacity and energy efficiency in urban and indoor settings. Its radios mount on the towers and rooftops leased from Amplitel, Indara and Waveconn.
Other players operating in the Australia telecom tower market include Telstra, TPG Telecom, Waveconn, Nokia, and Vocus, alongside tower construction contractors, power and battery suppliers, antenna manufacturers and site acquisition specialists supporting mobile operators across Australia.
Competition turns on tenancy contracts, delivery speed and relationships with the national operators rather than price, favouring owners that can upgrade sites for several carriers at once.


Upto 15% Off
AUD
$2749 $2499
$3849 $3499
$4949 $4499
$6049 $5499


*While we strive to always give you current and accurate information, the numbers depicted on the website are indicative and may differ from the actual numbers in the main report. At Expert Market Research, we aim to bring you the latest insights and trends in the market. Using our analyses and forecasts, stakeholders can understand the market dynamics, navigate challenges, and capitalize on opportunities to make data-driven strategic decisions.*
The Australia telecom tower market is valued at AUD 1850.00 million in 2025, supported by tower sales to specialist owners, regional network sharing and government co-funded coverage, with New South Wales as the largest base.
The market is forecast to reach AUD 3130.24 million by 2035, growing at a CAGR of 5.40 % over the 2026 to 2035 period, driven by small cell densification, neutral host construction and radio upgrades that add tenants to existing towers.
Small Cells and Distributed Antenna Systems record the highest CAGR at an estimated 9.3% through 2035, as operators densify cities and extend indoor coverage using new antenna systems from suppliers such as Ericsson.
New South Wales dominates, supported by the largest site base and 10 of the 17 sites funded in Round 8 of the Mobile Black Spot Program. Queensland is the fastest-growing region at an estimated 6.6% CAGR.
Key players include Amplitel, Indara, Optus, Ericsson, Telstra, TPG Telecom, Waveconn, Nokia, and Vocus.
It is an Australian Government program that co-funds new mobile base stations in areas with poor coverage. Round 8 funded 17 projects with AUD 21.1 million in March 2026, and 1,202 base stations were activated by April 2026.
Operators are selling sites to specialist owners and leasing them back. Optus agreed in September 2025 to sell about 340 towers and rooftops to Waveconn, keeping control of its active equipment.
Explore our key highlights of the report and gain a concise overview of key findings, trends, and actionable insights that will empower your strategic decisions.
| REPORT FEATURES | DETAILS |
| Base Year | 2025 |
| Historical Period | 2019-2025 |
| Forecast Period | 2026-2035 |
| Scope of the Report |
Historical and Forecast Trends, Industry Drivers and Constraints, Historical and Forecast Market Analysis by Segment:
|
| Breakup by Infrastructure Type |
|
| Breakup by Ownership Model |
|
| Breakup by Application |
|
| Breakup by Region |
|
| Market Dynamics |
|
| Competitive Landscape |
|
| Companies Covered |
|
Datasheet
AUD 2,749
AUD 2,499
tax inclusive*
Single User License
AUD 3,849
AUD 3,499
tax inclusive*
Five User License
AUD 4,949
AUD 4,499
tax inclusive*
Corporate License
AUD 6,049
AUD 5,499
tax inclusive*
*Please note that the prices mentioned below are starting prices for each bundle type. Kindly contact our team for further details.*
Flash Bundle
Small Business Bundle
Growth Bundle
Enterprise Bundle
*Please note that the prices mentioned below are starting prices for each bundle type. Kindly contact our team for further details.*
Flash Bundle
Number of Reports: 3
20%
tax inclusive*
Small Business Bundle
Number of Reports: 5
25%
tax inclusive*
Growth Bundle
Number of Reports: 8
30%
tax inclusive*
Enterprise Bundle
Number of Reports: 10
35%
tax inclusive*
How To Order

Select License Type
Choose the right license for your needs and access rights.

Click on ‘Buy Now’
Add the report to your cart with one click and proceed to register.

Select Mode of Payment
Choose a payment option for a secure checkout. You will be redirected accordingly.
Strategic Solutions for Informed Decision-Making
Stay upgraded and grab opportunities by strategic insights
Stay informed and aware for a Market Leverage
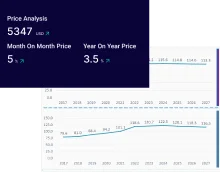
Analyze pricing patterns with comprehensive trend analyses.
Analyse trade data for supply chain insights.
Leverage cost reports for smart savings
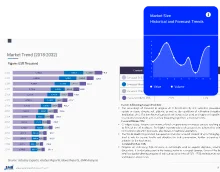
Elevate supply chain with collaboration
Contact Us for Further Information
Our specialized analysts will be available to answer all the pre-purchase and post-purchase queries regarding the report.
Our specialized analysts will be available to answer all the pre-purchase and post-purchase queries regarding the report.
Staying one step ahead of the market landscape with our in-depth research methods, integrating advanced analytics to drive precise and tangible outcomes.
Our expert analyst team offers a significant advantage over competitors, with extensive market insights into the latest trends, putting you strategically ahead.
We deliver a simplified yet extensive report, comprising in-depth industry insights and analytics tailored to your industry requirements.
We are happy to help you navigate through the services we offer and solve your queries.
Contact us