Consumer Insights
Uncover trends and behaviors shaping consumer choices today
Procurement Insights
Optimize your sourcing strategy with key market data
Industry Stats
Stay ahead with the latest trends and market analysis.
The Australia wind energy market covers spending on onshore and offshore wind projects, including turbines and towers, balance of plant and installation, grid connection works, operations and maintenance, and the survey and consenting work that precedes offshore construction. Projects sell power under retailer offtakes, state agreements and Commonwealth Capacity Investment Scheme contracts.
In 2025, the market is valued at AUD 5.10 billion and is forecast to grow at a CAGR of 8.40%, reaching AUD 11.43 billion by 2035. Growth is driven by coal retirements, a national plan that needs far more wind than the operating fleet, and a fresh run of financial closes and contract awards.
Compound Annual Growth Rate
8.4%
Value in AUD billion
2026-2035
The Australia wind energy market is emerging from a stalled period. Turbine orders ran dry through most of 2025, then a cluster of financial closes and government contracts restored momentum, while offshore wind moved from licensing towards environmental assessment.
Three forces shape the market: Commonwealth and state revenue support that gives developers bankable contracts; grid access and approval timelines that decide which projects proceed; and a shift to larger turbines that lowers the number of machines each site needs.
In December 2025 AEMO released its draft 2026 Integrated System Plan, in February 2026 the Clean Energy Council reported record commissioning in the final quarter of 2025, and in May 2026 the Capacity Investment Scheme awarded contracts to ten wind projects.
The market is moving from a thin pipeline of ageing approvals towards contracted, larger-turbine projects backed by Commonwealth and state revenue support. Onshore standalone wind still leads because most funded and operating capacity is on land, while offshore fixed-bottom wind and the highest-rated turbines advance fastest as Gippsland and Bunbury projects move through assessment. Victoria holds the largest base, and New South Wales grows quickest as South West Renewable Energy Zone projects secure grid access and contracts. Grid connection works and long-term maintenance contracts add a recurring layer that cushions the build cycle. Approvals, community acceptance and transmission delivery will set the pace, but the national plan makes this a durable multi-year build-out rather than a short-lived upswing.
| Metric | Value |
| Market Size 2025 | AUD 5.10 billion |
| Projected Market Size 2035 | AUD 11.43 billion |
| CAGR 2026 to 2035 | 8.40% |
| Fastest-Growing Installation Type | Offshore Fixed-Bottom Wind: 21.8% CAGR |
| Fastest-Growing Component | Operations and Maintenance Services: 10.8% CAGR |
| Largest Revenue Segment 2025 | Onshore Standalone Wind |
| Dominant Region | Victoria |
| Highest CAGR by Region | New South Wales: 10.8% |
| Wind and solar commissioned in Q4 2025 (Clean Energy Council) | 2.1 GW across nine projects |
Contracts and Plans Rebuild Momentum
Revenue is set to rise from AUD 5.10 billion in 2025 to AUD 11.43 billion in 2035 at an 8.4% CAGR, as contract awards and the national system plan convert into construction.
Offshore Wind and Maintenance Lead Growth
Onshore standalone wind remains the largest segment, but offshore fixed-bottom wind grows at an estimated 21.8% CAGR and operations and maintenance at 10.8% through 2035, as the operating fleet expands.
New South Wales and Western Australia Gain Share
New South Wales leads regional growth at an estimated 10.8% CAGR, while Western Australia combines Commonwealth contracts with the first Bunbury offshore licences.
| Report Summary | Unit | Value |
| Base Year | AUD billion | 2025 |
| Historical Period | AUD billion | 2019 to 2025 |
| Forecast Period | AUD billion | 2026 to 2035 |
| Market Size 2025 | AUD billion | 5.10 |
| Market Size 2035 | AUD billion | 11.43 |
| CAGR 2026 to 2035 | Percentage | 8.40 % |
| CAGR by Installation Type: Offshore Fixed-Bottom Wind | Percentage | 21.8 % |
| CAGR by Component: Operations and Maintenance Services | Percentage | 10.8 % |
| CAGR by Turbine Rating: Above 15 MW | Percentage | 23.0 % |
| CAGR by Region: New South Wales | Percentage | 10.8 % |
| AEMO Draft Wind Capacity Path 2035 | Gigawatts | 40 |
| Wind Projects Awarded in Capacity Investment Scheme Tender 7 | Number | 10 |
| Market Share by Region 2025 | Victoria | Dominant Share |
Revenue support, a national plan needing far more wind and restarted financial closes drive demand. Offshore wind and the largest turbines grow fastest while onshore standalone projects stay dominant.
The Australia wind energy market is being reshaped by large turbine orders in the west, federal approvals for gigawatt-scale projects, record contract awards and a higher wind path in the national plan.
October 2026 - Vestas Books 614 MW of Western Australian Orders
July 2026 - Theodore Wind Farm Wins Federal Environmental Approval
May 2026 - Capacity Investment Scheme Tender 7 Awards 4.8 GW of Wind
December 2025 - AEMO Raises Wind Ambition in Draft 2026 System Plan
Large turbine orders, federal approvals and contract rounds are converging, giving developers firmer revenue visibility and pushing projects from consenting towards construction, especially in the west and in Queensland.
Recent developments, presented from the most recent, show the Australia wind energy market moving from financial closes and licensing decisions into construction starts in the west.
July 2026 - Neoen Starts Construction of Narrogin Wind Farm
May 2026 - Six Western Australian Wind Farms Win Contracts
January 2026 - Bunbury Offshore Wind Zone Licences Announced
December 2025 - Four Wind Farms Reach Financial Close
Construction starts and licence decisions show projects passing consenting gates, although the licensing outcomes also reveal that offshore competition is narrowing and that some zones attract little developer interest.
The Expert Market Research’s report on the Australia Wind Energy Market offers a detailed analysis of the market based on the following segments.
Market Breakup by Installation Type
Onshore Standalone Wind leads because most financed and operating capacity sits on land, with Palmer in South Australia closing finance on 31 December 2025. Onshore Wind-Storage Hybrids grow at an estimated 10.2% CAGR, helped by Bungaban's 1,150 MW wind and battery award in May 2026. Offshore Fixed-Bottom Wind grows fastest at an estimated 21.8%, as Star of the South lodged its environmental impact statement in December 2025 for a 2.2 GW Gippsland project. Offshore Floating Wind grows at 17.5%, supported by the Hunter and Southern Ocean licences awarded in February 2025 to Equinor, Oceanex, Alinta and JERA Nex.
Market Breakup by Component
Wind Turbines and Towers lead, with Vestas booking 614 MW of Western Australian orders in October 2026 and Envision supplying Neoen's Narrogin machines in July 2026. Balance of Plant and Installation grows at an estimated 7.9%, as Tilt Renewables appointed BMD as principal contractor for Palmer. Grid Connection and Transmission Works grows at 9.9%, after Origin won full grid access for Yanco Delta in April 2025. Operations and Maintenance Services grow fastest at an estimated 10.8% CAGR, because new wind farms are signing 30-year service agreements such as those attached to the October 2026 Vestas orders.
Market Breakup by Turbine Rating
6 to 8 MW leads, covering the V162-6.2 MW machines ordered for Western Australia in October 2026, the V172-7.2 MW units at Palmer and the EN182-7.8 MW turbines at Narrogin. Up to 6 MW declines in share as developers move to larger machines, with GE Vernova's 6.2 MW units chosen for Carmody's Hill in December 2025. 8 to 15 MW grows at an estimated 13.5%, as offshore demonstration and licence holders select larger models. Above 15 MW grows fastest at an estimated 23.0% CAGR, because Star of the South's December 2025 filing specifies machines of at least 15 MW.
Market Breakup by Region
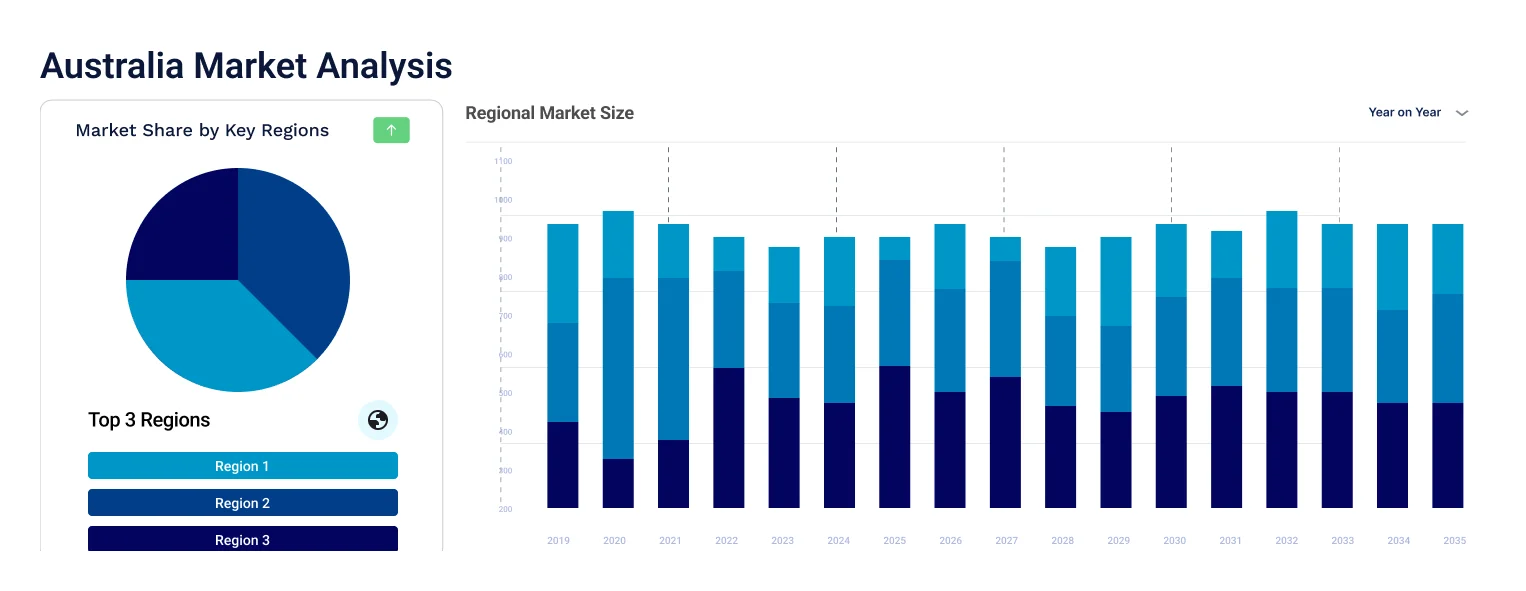
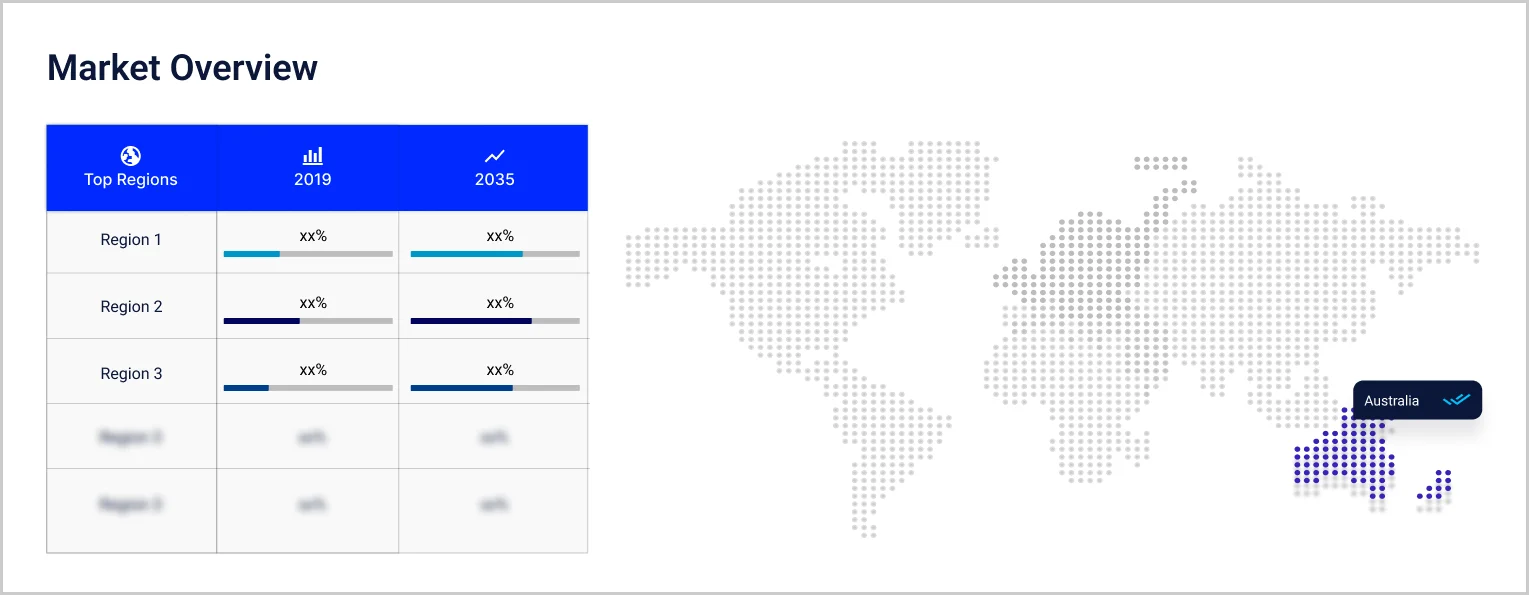
Victoria is estimated to dominate 2025 spending through its operating fleet, Delburn's financial close in December 2025 and Gippsland offshore development, and grows at 7.1% CAGR. New South Wales is fastest at an estimated 10.8%, helped by Yanco Delta, Baldon and Bullawah awards. Queensland grows at 9.2%, with Clarke Creek stage two financed in December 2025, even though the state government cancelled the 1,200 MW Forest Wind project in September 2025. Western Australia grows at 9.5% and South Australia at 7.6%. Others, grouping Tasmania, the ACT and the Northern Territory, grows at 8.0%, led by Tasmania's Cellars Hill award.
| CAGR 2026 to 2035, Market by Region | Growth Rate |
| Victoria | 7.1 % |
| New South Wales | 10.8 % |
| Queensland | 9.2 % |
| Western Australia | 9.5 % |
| South Australia | 7.6 % |
| Others (incl. Tasmania, Australian Capital Territory and Northern Territory) | 8.0 % |
Competition combines global turbine makers, Australian developer-owners and international utilities. Barriers include grid access, approval timelines, local acceptance, supply contracts for large turbines and the balance sheet needed to reach financial close.
Vestas
Vestas is a wind turbine manufacturer headquartered in Aarhus, Denmark, supplying onshore turbines and long-term service across Australia. In October 2026 it announced 614 MW of Western Australian orders, comprising 99 V162-6.2 MW turbines for the Parron Maam Marang and Kondinin projects, each with a 30-year service agreement. In December 2025 it also won orders for Tilt Renewables' Waddi project and the Delburn wind farm.
Goldwind
Goldwind is a Chinese turbine manufacturer and developer operating in Australia through Goldwind Australia, based in Melbourne. It supplies the turbines at Squadron Energy's Clarke Creek wind farm in Queensland, where stage one was powered up by December 2025. In May 2026 its 346 MW Baldon wind farm in New South Wales won a Capacity Investment Scheme contract in tender 7.
Squadron Energy
Squadron Energy is an Australian renewable and gas developer backed by Andrew Forrest and based in Sydney. In December 2025 it closed AUD 1 billion of financing for stage two of the Clarke Creek wind farm, adding 88 turbines and 704 MW to the 450 MW first stage. The precinct, roughly halfway between Rockhampton and Mackay, is expected to exceed 1 GW overall.
Tilt Renewables
Tilt Renewables is an Australian-owned wind and solar developer headquartered in Melbourne. In December 2025 it approved the 108 MW Waddi wind farm in Western Australia and sealed financing on 31 December 2025 for the 288 MW Palmer wind farm, about 70 km east of Adelaide. Palmer uses 40 Vestas turbines, holds a Capacity Investment Scheme agreement and an AGL offtake, and was scheduled for construction from mid-2026.
Other players operating in the Australia wind energy market include Neoen, Origin Energy, RWE, GE Vernova, and EDF Power Solutions Australia, alongside turbine suppliers, transmission operators, construction contractors and maintenance providers supporting wind projects across Australia.
Competition turns on contract wins, turbine supply security and grid access rather than price alone, favouring developers with strong balance sheets and manufacturers pairing large machines with long service agreements.


Upto 15% Off
AUD
$2749 $2499
$3849 $3499
$4949 $4499
$6049 $5499


*While we strive to always give you current and accurate information, the numbers depicted on the website are indicative and may differ from the actual numbers in the main report. At Expert Market Research, we aim to bring you the latest insights and trends in the market. Using our analyses and forecasts, stakeholders can understand the market dynamics, navigate challenges, and capitalize on opportunities to make data-driven strategic decisions.*
The Australia wind energy market is valued at AUD 5.10 billion in 2025, supported by Capacity Investment Scheme contracts, a national plan that needs far more wind and a restart in financial closes, with Victoria as the largest regional base.
The market is forecast to reach AUD 11.43 billion by 2035, growing at a CAGR of 8.40 % over the 2026 to 2035 period, driven by offshore wind assessment, larger turbines, grid connection works and the growth of long-term maintenance contracts as the operating fleet expands.
Offshore Fixed-Bottom Wind records the highest CAGR at an estimated 21.8% through 2035, as Gippsland and Bunbury projects move through environmental assessment and licensing from a small 2025 base.
Victoria dominates by estimated 2025 spending, supported by its operating fleet, Delburn and Gippsland offshore development. New South Wales is the fastest-growing region at an estimated 10.8% CAGR, helped by Yanco Delta and Baldon.
Key players include Vestas, Goldwind, Squadron Energy, Tilt Renewables, Neoen, Origin Energy, RWE, GE Vernova, and EDF Power Solutions Australia.
It is a Commonwealth programme that awards revenue-underwriting contracts to new generation and storage. Tender 7, announced in May 2026, awarded 7.8 GW across 19 projects, including ten wind projects totalling 4.8 GW.
It lets a developer carry out surveys and assessments in a declared zone but does not permit construction. In January 2026 the federal government offered three Bunbury feasibility licences covering up to about 4 GW.
Explore our key highlights of the report and gain a concise overview of key findings, trends, and actionable insights that will empower your strategic decisions.
| REPORT FEATURES | DETAILS |
| Base Year | 2025 |
| Historical Period | 2019-2025 |
| Forecast Period | 2026-2035 |
| Scope of the Report |
Historical and Forecast Trends, Industry Drivers and Constraints, Historical and Forecast Market Analysis by Segment:
|
| Breakup by Installation Type |
|
| Breakup by Component |
|
| Breakup by Turbine Rating |
|
| Breakup by Region |
|
| Market Dynamics |
|
| Competitive Landscape |
|
| Companies Covered |
|
Datasheet
AUD 2,749
AUD 2,499
tax inclusive*
Single User License
AUD 3,849
AUD 3,499
tax inclusive*
Five User License
AUD 4,949
AUD 4,499
tax inclusive*
Corporate License
AUD 6,049
AUD 5,499
tax inclusive*
*Please note that the prices mentioned below are starting prices for each bundle type. Kindly contact our team for further details.*
Flash Bundle
Small Business Bundle
Growth Bundle
Enterprise Bundle
*Please note that the prices mentioned below are starting prices for each bundle type. Kindly contact our team for further details.*
Flash Bundle
Number of Reports: 3
20%
tax inclusive*
Small Business Bundle
Number of Reports: 5
25%
tax inclusive*
Growth Bundle
Number of Reports: 8
30%
tax inclusive*
Enterprise Bundle
Number of Reports: 10
35%
tax inclusive*
How To Order

Select License Type
Choose the right license for your needs and access rights.

Click on ‘Buy Now’
Add the report to your cart with one click and proceed to register.

Select Mode of Payment
Choose a payment option for a secure checkout. You will be redirected accordingly.
Strategic Solutions for Informed Decision-Making
Stay upgraded and grab opportunities by strategic insights
Stay informed and aware for a Market Leverage
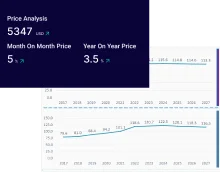
Analyze pricing patterns with comprehensive trend analyses.
Analyse trade data for supply chain insights.
Leverage cost reports for smart savings
Elevate supply chain with collaboration
Contact Us for Further Information
Our specialized analysts will be available to answer all the pre-purchase and post-purchase queries regarding the report.
Our specialized analysts will be available to answer all the pre-purchase and post-purchase queries regarding the report.
Staying one step ahead of the market landscape with our in-depth research methods, integrating advanced analytics to drive precise and tangible outcomes.
Our expert analyst team offers a significant advantage over competitors, with extensive market insights into the latest trends, putting you strategically ahead.
We deliver a simplified yet extensive report, comprising in-depth industry insights and analytics tailored to your industry requirements.
We are happy to help you navigate through the services we offer and solve your queries.
Contact us