Consumer Insights
Uncover trends and behaviors shaping consumer choices today
Procurement Insights
Optimize your sourcing strategy with key market data
Industry Stats
Stay ahead with the latest trends and market analysis.
The Australia magnetic resonance imaging market covers MRI scanners, upgrades and software, service contracts, and the helium, coils and accessories supplied to hospitals, radiology clinics and research institutes. It spans 1.5T and 3T clinical systems, lower-field open designs and research scanners that image soft tissue without ionising radiation.
In 2025, the market is valued at AUD 365.00 million and is forecast to grow at a CAGR of 6.10%, reaching AUD 659.85 million by 2035. Growth is driven by Medicare licence reform, public hospital imaging programs and the shift to wide-bore, AI-accelerated and low-helium systems.
Compound Annual Growth Rate
6.1%
Value in AUD million
2026-2035
The Australia magnetic resonance imaging market is moving from a licence-restricted fleet to a competitive, practice-based market. Private radiology groups, state hospital programs and research facilities are all adding or replacing scanners, with vendors competing on scan speed, bore size and helium use.
Three forces are shaping demand: practice-based Medicare licences from 1 July 2025, with equipment licensing due to end on 1 July 2027; Queensland's A$276 million program for six public MRI machines, announced in October 2025; and helium supply concerns that favour sealed magnets.
The Australian Institute of Health and Welfare reports about 1.6 million Medicare-subsidised MRI services in 2024-25, up 60% in a decade, and in May 2026 Jardine Matheson agreed to buy I-MED Radiology Network.
The market is shifting from a licence-limited fleet towards a broader, practice-based network with stronger hospital and research investment. 1.5T systems lead revenue today because most Medicare-eligible practices run them, while 3T advances fastest as hospitals, children's services and research centres buy higher-gradient, AI-accelerated scanners. Oncology imaging grows as breast and pelvic indications widen, and hospitals expand as states fund public capacity. Sealed and low-helium magnets gain attention as imported helium supply tightens. New South Wales remains the largest state, and Queensland builds fastest as its public program moves from announcement to construction. Replacement cycles and service contracts keep the installed base valuable beyond new system sales.
| Metric | Value |
| Market Size 2025 | AUD 365.00 million |
| Projected Market Size 2035 | AUD 659.85 million |
| CAGR 2026 to 2035 | 6.10% |
| Fastest-Growing Field Strength | 3T: 8.1% CAGR |
| Fastest-Growing End User | Hospitals: 7.6% CAGR |
| Largest Revenue Segment 2025 | 1.5T |
| Dominant Region | New South Wales |
| Highest CAGR by Region | Queensland: 6.9% |
| Medicare-subsidised MRI services, 2024-25 | About 1.6 million |
Licence Reform Widens Access Beyond Specialist Referrals
Revenue should grow from AUD 365.00 million in 2025 to AUD 659.85 million in 2035 at a 6.1% CAGR, as practice-based licences and the planned end of equipment licensing in July 2027 widen Medicare access.
3T And Hospital Programs Lead Growth
1.5T holds the largest share, but 3T grows at an estimated 8.1% CAGR and hospitals at 7.6%, helped by new 3T installations at Newcastle, Brisbane and Perth Children's Hospital.
State Programs Add Public Scanner Capacity
Public health services are funding new scanners beyond metropolitan teaching hospitals, creating tender demand for vendors and service providers.
| Report Summary | Unit | Value |
| Base Year | AUD million | 2025 |
| Historical Period | AUD million | 2019 to 2025 |
| Forecast Period | AUD million | 2026 to 2035 |
| Market Size 2025 | AUD million | 365.00 |
| Market Size 2035 | AUD million | 659.85 |
| CAGR 2026 to 2035 | Percentage | 6.10 % |
| CAGR by Field Strength: 3T | Percentage | 8.1 % |
| CAGR by Application: Oncology | Percentage | 7.3 % |
| CAGR by End User: Hospitals | Percentage | 7.6 % |
| CAGR by Region: Queensland | Percentage | 6.9 % |
| Medicare-Subsidised MRI Services, 2024-25 | Million Services | 1.6 |
| New Public MRI Machines Funded in Queensland, October 2025 | Machines | 6 |
| Market Share by Region 2025 | New South Wales | Dominant Share |
Demand is structural. Licence reform, public hospital programs and ageing fleets support growth, while 3T, oncology and hospital segments expand faster than the overall market through 2035.
The Australia magnetic resonance imaging market is being reshaped by licence-driven volume growth, helium supply concerns, higher-field research systems and the first year of practice-based Medicare licensing.
August 2026 - Integral Diagnostics Credits MRI De-Regulation For Growth
June 2026 - UNSW Highlights Australia's Helium Import Dependence
February 2026 - Siemens 3T Scanners Open At Newcastle And Brisbane
July 2025 - Practice-Based MRI Licences Replace Equipment Licences
Reform and results point the same way. Deregulation is lifting volumes, research sites are adopting 3T, and helium supply risk is steering buyers towards sealed magnets.
Recent developments, presented from the most recent, show the Australia magnetic resonance imaging market moving from licence reform into ownership change, fee indexation and state-funded capacity.
August 2026 - Sonic Healthcare Reports MRI Growth And Margin Effects
July 2026 - Medicare Changes Lift Fees And Widen Breast MRI Claiming
May 2026 - Jardine Matheson Agrees To Acquire I-MED Radiology Network
October 2025 - Queensland Funds Six New Public MRI Machines
Recent events show capital arriving. Listed groups report licence-driven growth, an owner change is under way at a major network, and states are funding public capacity.
The Expert Market Research’s report on the Australia Magnetic Resonance Imaging Market offers a detailed analysis of the market based on the following segments.
Market Breakup by Field Strength
1.5T leads because most licensed practices run wide-bore 1.5T fleets, and Siemens Healthineers lists a 1.5T MAGNETOM Flow platform with 0.7 litres of liquid helium. 3T grows fastest at an estimated 8.1% CAGR through 2035, as Perth Children's Hospital began scanning on a A$2.5 million 3T system on 3 June 2026 and the Herston and Newcastle 3T scanners opened in February 2026. Below 1.5T covers open, upright and extremity designs, which draw interest as a June 2026 UNSW article stressed Australia's dependence on imported helium. Above 3T is confined to research sites in the National Imaging Facility network, whose 14 partners share NCRIS-funded scanners.
Market Breakup by Application
Musculoskeletal leads because GP-requested joint scans dominate volumes, and PRP Diagnostic Imaging said in August 2025 that its Wollongong and Shellharbour sites could offer 120 Medicare-funded scan types after licensing changed. Oncology grows fastest at an estimated 7.3% CAGR through 2035, as breast MRI item 63464 lost its Multiple Services Rule restriction on 1 July 2026. Neurology draws on Newcastle's February 2026 scanner for brain cancer and dementia research. Cardiovascular benefits from Wollongong Hospital's October 2025 MRI, planned for breast, biopsy and cardiac imaging. Others includes paediatric, abdominal and pelvic examinations.
Market Breakup by End User
Diagnostic Imaging Centres lead because private groups hold most licensed capacity, and Integral Diagnostics said in August 2026 that MRI de-regulation supported 8.9% growth in its legacy business. Hospitals grow fastest at an estimated 7.6% CAGR through 2035, supported by Queensland's October 2025 program, the Alfred's wide-bore bariatric scanner funded in July 2025 and Eurobodalla Regional Hospital's machine, installed in September 2026. Research and Academic Institutes rely on the University of Queensland's February 2026 opening. Others covers mobile and specialist clinics, which follow the same licence reform as practice-based operators.
Market Breakup by Region
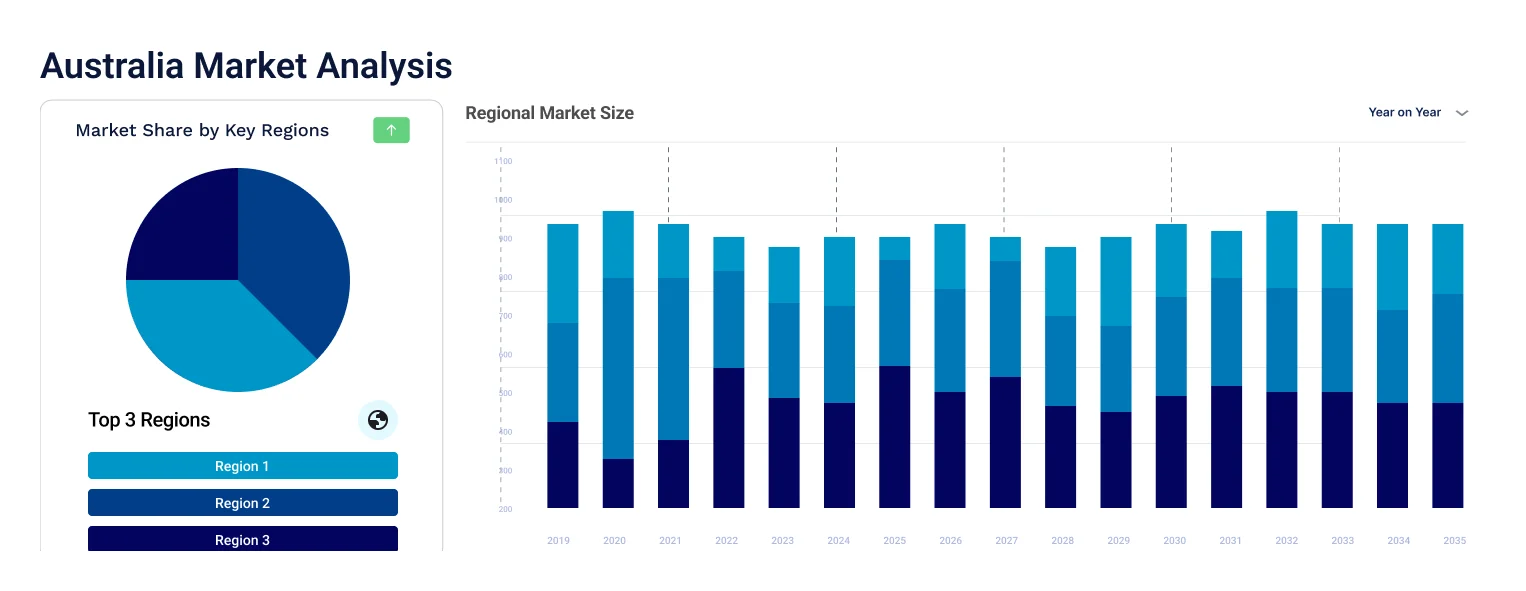
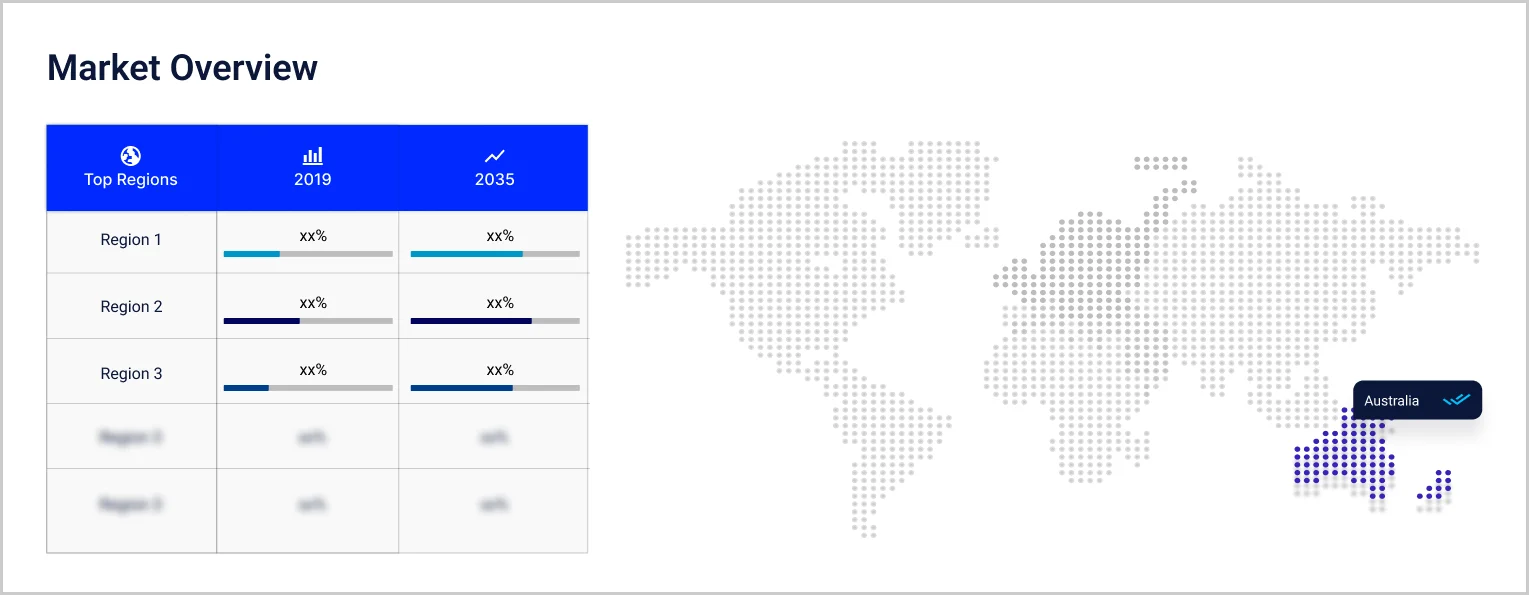
New South Wales dominates, anchored by the Wollongong Hospital MRI installed in October 2025 and the Eurobodalla machine delivered in September 2026, and grows at an estimated 5.7% CAGR. Queensland is fastest at an estimated 6.9%, after announcing six public machines in October 2025. Western Australia grows at 6.5%, led by Perth Children's 3T scanner in June 2026. South Australia, at 6.3%, will gain a new SA Medical Imaging scanner at the Repat precinct by the end of 2026. Victoria, at 5.8%, funded a wide-bore bariatric scanner for Alfred Health in July 2025. Others, at 5.5%, covers Tasmania, the ACT and the Northern Territory.
| CAGR 2026 to 2035, Market by Region | Growth Rate |
| New South Wales | 5.7 % |
| Victoria | 5.8 % |
| Queensland | 6.9 % |
| Western Australia | 6.5 % |
| South Australia | 6.3 % |
| Others (incl. Tasmania, ACT and Northern Territory) | 5.5 % |
Competition combines global scanner makers, radiology groups and research-linked buyers. Entry barriers include installed-base service networks, Medicare licence eligibility, helium resilience, capital for replacement cycles and the ability to deliver faster AI-assisted acquisition.
Siemens Healthineers
Siemens Healthineers, headquartered in Erlangen, Germany, supplies the MAGNETOM range in Australia, including the 1.5T MAGNETOM Flow with 0.7 litres of liquid helium and 3T Cima.X systems. In February 2026 a 3T MAGNETOM Cima.X Fit upgrade was completed at the HMRI Imaging Centre in Newcastle, and a Cima.X opened at Herston Imaging Research Facility in Brisbane, an investment of approximately A$1.8 million.
Philips
Philips supplies MRI to Australian hospitals and clinics through its Australia and New Zealand imaging business. In August 2026 Ari Wood, its acting head of imaging, said the BlueSeal magnet uses about 7 litres of helium sealed for life, against about 1,500 litres in conventional systems, with more than 2,000 BlueSeal systems installed worldwide. In November 2025 Philips previewed BlueSeal Horizon, a helium-free 3.0T platform not yet available in any jurisdiction.
I-MED Radiology Network
I-MED Radiology Network, formed in 2000, offers MRI alongside CT, PET, nuclear medicine, ultrasound and X-ray across 215 clinics in Australia and New Zealand, with more than 500 radiologists in Australia. On 25 May 2026 Jardine Matheson agreed to acquire it from funds advised by Permira at an enterprise value of A$3.4 billion, with completion expected later in 2026.
Integral Diagnostics
Integral Diagnostics, headquartered in East Melbourne, operates radiology practices in Australia and New Zealand, including the former Capitol Health sites. At its October 2025 annual meeting it said 16 partial MRI licences became full on 1 July 2025, leaving 42 fully licensed and 22 unlicensed MRI machines. Its FY26 results on 25 August 2026 reported revenue of A$788.7 million.
Other players operating in the Australia magnetic resonance imaging market include Sonic Healthcare, GE HealthCare, Canon Medical Systems, Fujifilm, and Qscan, alongside independent radiology practices, service providers and distributors supplying scanners, coils and maintenance across Australia.
Competition combines global scanner makers and radiology groups. Winning depends on installed-base service, helium resilience, AI reconstruction, licence-ready sites and access to capital for replacement cycles.


Upto 15% Off
AUD
$2749 $2499
$3849 $3499
$4949 $4499
$6049 $5499


*While we strive to always give you current and accurate information, the numbers depicted on the website are indicative and may differ from the actual numbers in the main report. At Expert Market Research, we aim to bring you the latest insights and trends in the market. Using our analyses and forecasts, stakeholders can understand the market dynamics, navigate challenges, and capitalize on opportunities to make data-driven strategic decisions.*
The Australia magnetic resonance imaging market is valued at AUD 365.00 million in 2025, supported by Medicare licence reform, state hospital imaging programs and rising demand for 3T and AI-accelerated systems.
The market is forecast to reach AUD 659.85 million by 2035, growing at a CAGR of 6.10 % over the 2026 to 2035 period, driven by the planned end of MRI equipment licensing in July 2027, hospital capacity programs and the shift to low-helium magnets.
3T records the highest CAGR at an estimated 8.1% through 2035, supported by new 3T scanners at Perth Children's Hospital, Newcastle and Herston, and demand for higher-resolution neurological and oncology imaging.
New South Wales dominates, anchored by the country's largest population and new machines at Wollongong and Eurobodalla. Queensland is the fastest-growing state at an estimated 6.9% CAGR, helped by its public MRI program.
Key players include Siemens Healthineers, Philips, I-MED Radiology Network, Integral Diagnostics, Sonic Healthcare, GE HealthCare, Canon Medical Systems, Fujifilm, and Qscan.
It is a staged federal change that replaced equipment-based licences with practice-based licences on 1 July 2025. A second stage planned for 1 July 2027 removes the licence requirement in metropolitan areas.
It is a superconducting magnet sealed at manufacture with a small helium charge, such as Philips' BlueSeal at about 7 litres, so it needs no refills and reduces exposure to imported helium.
Explore our key highlights of the report and gain a concise overview of key findings, trends, and actionable insights that will empower your strategic decisions.
| REPORT FEATURES | DETAILS |
| Base Year | 2025 |
| Historical Period | 2019-2025 |
| Forecast Period | 2026-2035 |
| Scope of the Report |
Historical and Forecast Trends, Industry Drivers and Constraints, Historical and Forecast Market Analysis by Segment:
|
| Breakup by Field Strength |
|
| Breakup by Application |
|
| Breakup by End User |
|
| Breakup by Region |
|
| Market Dynamics |
|
| Competitive Landscape |
|
| Companies Covered |
|
Datasheet
AUD 2,749
AUD 2,499
tax inclusive*
Single User License
AUD 3,849
AUD 3,499
tax inclusive*
Five User License
AUD 4,949
AUD 4,499
tax inclusive*
Corporate License
AUD 6,049
AUD 5,499
tax inclusive*
*Please note that the prices mentioned below are starting prices for each bundle type. Kindly contact our team for further details.*
Flash Bundle
Small Business Bundle
Growth Bundle
Enterprise Bundle
*Please note that the prices mentioned below are starting prices for each bundle type. Kindly contact our team for further details.*
Flash Bundle
Number of Reports: 3
20%
tax inclusive*
Small Business Bundle
Number of Reports: 5
25%
tax inclusive*
Growth Bundle
Number of Reports: 8
30%
tax inclusive*
Enterprise Bundle
Number of Reports: 10
35%
tax inclusive*
How To Order

Select License Type
Choose the right license for your needs and access rights.

Click on ‘Buy Now’
Add the report to your cart with one click and proceed to register.

Select Mode of Payment
Choose a payment option for a secure checkout. You will be redirected accordingly.
Strategic Solutions for Informed Decision-Making
Stay upgraded and grab opportunities by strategic insights
Stay informed and aware for a Market Leverage
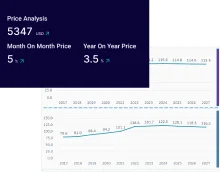
Analyze pricing patterns with comprehensive trend analyses.
Analyse trade data for supply chain insights.
Leverage cost reports for smart savings
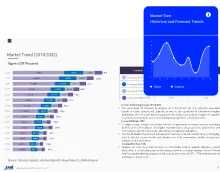
Elevate supply chain with collaboration
Contact Us for Further Information
Our specialized analysts will be available to answer all the pre-purchase and post-purchase queries regarding the report.
Our specialized analysts will be available to answer all the pre-purchase and post-purchase queries regarding the report.
Staying one step ahead of the market landscape with our in-depth research methods, integrating advanced analytics to drive precise and tangible outcomes.
Our expert analyst team offers a significant advantage over competitors, with extensive market insights into the latest trends, putting you strategically ahead.
We deliver a simplified yet extensive report, comprising in-depth industry insights and analytics tailored to your industry requirements.
We are happy to help you navigate through the services we offer and solve your queries.
Contact us