Consumer Insights
Uncover trends and behaviors shaping consumer choices today
Procurement Insights
Optimize your sourcing strategy with key market data
Industry Stats
Stay ahead with the latest trends and market analysis.
The Australia data centre power market covers the electrical equipment that keeps data centres running without interruption: uninterruptible power supply (UPS) systems, diesel and gas generators, switchgear, power distribution units, busways, lithium-ion batteries and the grid-interface and cooling-related power gear that sit between the network connection and the server rack. Demand comes from hyperscale campuses, colocation halls, enterprise rooms and edge sites, concentrated in Sydney and Melbourne.
In 2025, the market is valued at AUD 1180.00 million in 2025 and is forecast to grow at a (CAGR) of 12.00%, reaching AUD 3664.90 million by 2035. Growth is driven by a transmission connection queue of 9 GW reported by the Australian Energy Market Operator (AEMO) in July 2026, a national pipeline of about 6 GW of proposed capacity and the shift to dense AI halls that need larger, faster-responding power systems.
Compound Annual Growth Rate
12%
Value in AUD million
2026-2035
The Australia data centre power market is expanding faster than the grid that feeds it. AI training halls, hyperscale cloud regions and colocation campuses are pushing rack power densities up, and every added megawatt of load needs matching UPS, generator, switchgear and battery capacity inside the fence line.
Three forces shape the market: grid access, since AEMO tracks 225 potential projects but reports that more than 40% have dropped out or moved backward; policy, with federal expectations asking developers to underwrite new renewable supply; and technology, as lithium-ion storage and modular power rooms replace lead-acid and diesel-only designs.
In March 2026 the Australian Government released national data centre expectations. In July 2026 AEMO reported 9 GW of data centres in the transmission connection process, and in August 2026 its electricity statement projected a seven-fold rise in data centre consumption over the decade.
The market is moving from backup-only power towards active, grid-interactive systems. Switchgear and power distribution lead in value because every megawatt of load needs transformers, switchboards and busways, while batteries and energy storage advance fastest as lithium-ion systems replace lead-acid UPS blocks. Colocation remains the largest buyer, but hyperscale and AI campuses grow quickest, and facilities above 100 MW outpace smaller halls. New South Wales remains the largest region and Queensland grows quickest as large campuses move north. Federal expectations and connection delays favour suppliers offering modular, pre-tested power rooms and local service support.
| Metric | Value |
| Market Size 2025 | AUD 1180.00 million |
| Projected Market Size 2035 | AUD 3664.90 million |
| CAGR 2026 to 2035 | 12.00% |
| Fastest-Growing Equipment Type | Batteries and Energy Storage: 16.2% CAGR |
| Fastest-Growing Data Centre Type | Hyperscale and AI Campuses: 14.4% CAGR |
| Largest Revenue Segment 2025 | Switchgear and Power Distribution |
| Dominant Region | New South Wales |
| Highest CAGR by Region | Queensland: 14.8% |
| Potential data centre projects in AEMO forecast, August 2026 | 225 projects |
Grid Queue Anchors a Decade of Equipment Demand
Revenue is on course to more than triple, from USD 1,180.00 million in 2025 to USD 3,664.90 million in 2035 at a 12.0% CAGR. AEMO's July 2026 count of 9 GW in the connection process shows how much electrical plant waits behind each approval, even though many projects will slip.
Storage and AI Campuses Lead Growth
Switchgear and Power Distribution holds the largest share, but Batteries and Energy Storage grows at an estimated 16.2% CAGR and Hyperscale and AI Campuses at an estimated 14.4% CAGR through 2035. Facilities above 100 MW rise at an estimated 15.3%, as Zerra DC's August 2026 application shows.
Policy and Delivery Risk Shape Supplier Strategy
Federal expectations ask new data centres to underwrite renewable supply, pay their share of network costs and offer demand flexibility, which favours battery-backed designs. Delivery risk is real, because AEMO reports that more than 40% of projects have dropped out or moved backward since 2025.
| Report Summary | Unit | Value |
| Base Year | AUD million | 2025 |
| Historical Period | AUD million | 2019 to 2025 |
| Forecast Period | AUD million | 2026 to 2035 |
| Market Size 2025 | AUD million | 1180.00 |
| Market Size 2035 | AUD million | 3664.90 |
| CAGR 2026 to 2035 | Percentage | 12.00 % |
| CAGR by Equipment Type: Batteries and Energy Storage | Percentage | 16.2 % |
| CAGR by Data Centre Type: Hyperscale and AI Campuses | Percentage | 14.4 % |
| CAGR by Facility Capacity: Above 100 MW | Percentage | 15.3 % |
| CAGR by Region: Queensland | Percentage | 14.8 % |
| Potential Data Centre Projects in AEMO Forecast | Projects | 225 |
| Data Centre Connections in Transmission Process | Gigawatts | 9 |
| Market Share by Region 2025 | New South Wales | Dominant Share |
Equipment demand follows grid connections, and storage-led, high-density designs are replacing backup-only systems. New South Wales leads, while Queensland grows fastest as large campuses spread.
The Australia data centre power market is being reshaped by connection queues, federal policy expectations, state fast-tracks and rising grid-operator demand forecasts.
August 2026 - AEMO Forecasts Seven-Fold Rise in Data Centre Power Use
July 2026 - AEMO Reports 9 GW of Data Centres in Transmission Connection Process
March 2026 - Federal Government Releases National Data Centre Expectations
February 2026 - Victoria Approves NEXTDC's 162 MW Port Melbourne Campus
Forecast growth in grid demand, long connection queues and national expectations on renewable supply and demand flexibility are steering buyers towards storage-backed, modular power systems and phased energisation.
Recent developments, presented from the most recent, show multi-gigawatt campus plans, operator expansion approvals, hyperscale investment and new Western Australian capacity.
August 2026 - Zerra DC Lodges 1.44 GW Western Downs Campus Application in Queensland
July 2026 - NEXTDC's Eastern Creek S7 Planning Documents Show 612 MW
December 2025 - AirTrunk Announces MEL2 With Over 354 MW and AUD 5 Billion Investment
August 2025 - CDC Data Centres Plans 200 MW Campus at Maddington, Western Australia
Multi-gigawatt campus plans, large operator expansions and a first major Western Australian site signal power rooms that suppliers must stage, deliver and service over many years.
The Expert Market Research’s report on the Australia Data Centre Power Market offers a detailed analysis of the market based on the following segments.
Market Breakup by Equipment Type
Switchgear and Power Distribution leads on value, in our estimate, because every megawatt of load needs switchboards, transformers, busways and distribution units, and Zerra DC's August 2026 Queensland plan includes its own 275 kV and 330 kV switching stations. UPS Systems follow, with Vertiv backing its Australian and New Zealand channel partners in July 2026. Generators and Gensets hold steady on resilience needs, with Rehlko noting in August 2026 that AI loads strain generators and alternators. Batteries and Energy Storage grow fastest at an estimated 16.2% CAGR through 2035, as federal expectations of March 2026 ask for demand flexibility.
Market Breakup by Data Centre Type
Colocation leads on value, in our estimate, with NEXTDC's 162 MW Port Melbourne approval of February 2026 and CDC's 200 MW Maddington plan of August 2025 showing operator scale. Hyperscale and AI Campuses grow fastest at an estimated 14.4% CAGR through 2035, as AirTrunk's December 2025 MEL2 announcement of more than 354 MW and Goodman's 90 MW Sydney build reported in February 2026 show. Enterprise facilities grow slowly as workloads move to the cloud. Edge sites expand in regional and telecommunications settings, buying compact UPS and battery cabinets.
Market Breakup by Facility Capacity
Facilities from 10 MW to 50 MW lead on value, in our estimate, because most of the 162 operating sites counted by CommBank in August 2026 are far smaller than the headline campuses. Below 10 MW covers enterprise, edge and regional rooms. Facilities from 50 MW to 100 MW grow quickly as in-fill sites in Sydney and Melbourne are densified. Above 100 MW grows fastest at an estimated 15.3% CAGR through 2035, since only 3 of those 162 sites exceed that size today and Zerra DC's 1.44 GW application of August 2026 points to many more.
Market Breakup by Region
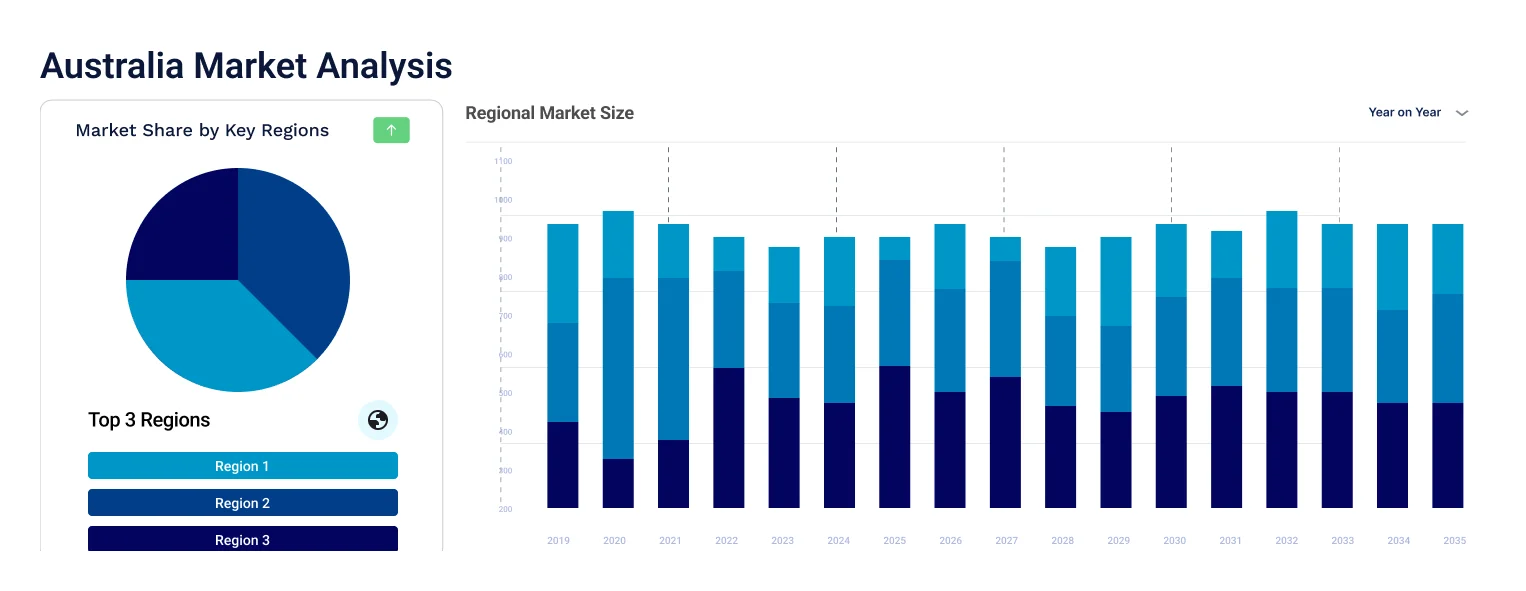
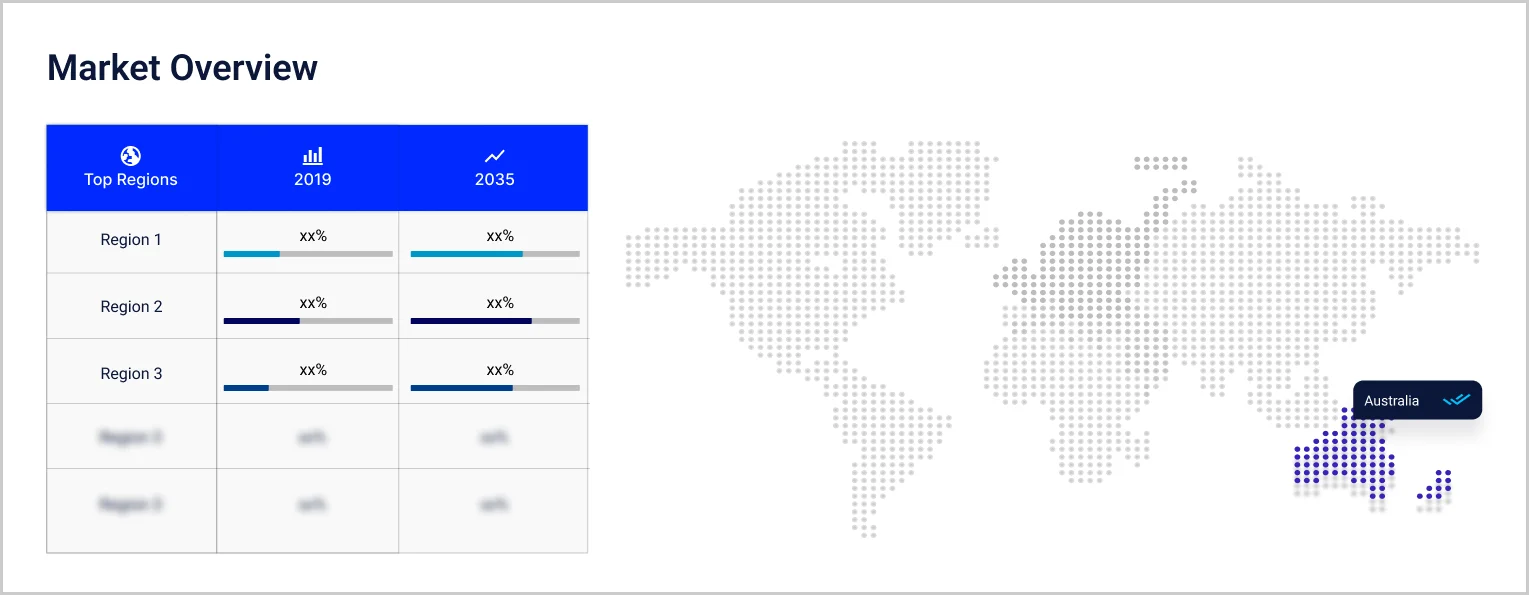
New South Wales dominates, in our estimate, with over half of the new connection capacity in AEMO's July 2026 report, and it grows at an estimated 11.0% CAGR through 2035 from a large base. Victoria grows at 12.5%, helped by its February 2026 approval of NEXTDC's Port Melbourne campus. Queensland is the fastest-growing region at an estimated 14.8%, on the Western Downs proposal of August 2026. Western Australia grows at 13.9% as CDC's Maddington campus is built. Others, covering South Australia, the Australian Capital Territory, Tasmania and the Northern Territory, grow at 12.7%; they are grouped because each is small.
| CAGR 2026 to 2035, Market by Region | Growth Rate |
| New South Wales | 11.0 % |
| Victoria | 12.5 % |
| Queensland | 14.8 % |
| Western Australia | 13.9 % |
| Others (incl. South Australia, Australian Capital Territory, Tasmania and Northern Territory) | 12.7 % |
Competition combines global electrical majors, generator makers and local integrators selling through contractors and operators. Entry barriers include factory test capacity, local service coverage, lead times on switchgear and generators, and operator approved-vendor lists.
Vertiv
Vertiv, headquartered in Westerville, Ohio, supplies UPS systems, power distribution, switchgear, busways and thermal products for data centres. In March 2026 it joined SUSE in warning that electricity use is becoming a binding constraint for Australian operators. On 28 July 2026 ChannelLife reported that Vertiv was backing its Australian and New Zealand channel partners as AI-ready power and cooling demand grew.
Rehlko
Rehlko, the company formerly known as Kohler Energy, based in Wisconsin, makes generators, alternators, battery energy storage, on-site gas generation and modular e-POD power infrastructure for data centres. In August 2026 it said it operates from 80 locations and has deployed more than 14 GW of capacity. Its AI-readiness eBook argues that variable AI loads strain generators and UPS designs.
Eaton
Eaton, headquartered in Dublin, Ireland, supplies UPS systems, switchgear, busways, power distribution units and circuit protection for data centres. On 17 August 2026 IT Brief Australia reported that Eaton and Trane had unveiled a joint AI data centre reference design intended to lower installation costs and reduce copper use. Pre-engineered power and cooling blocks suit Australian campuses where connection delays compress schedules.
Schneider Electric
Schneider Electric, headquartered in Rueil-Malmaison, France, sells APC and Galaxy UPS systems, switchgear, busways and EcoStruxure software for data centres. In May 2025 IT Brief Australia described it as a leader in liquid cooling for AI data centres. Its APC channel partners and large power-distribution projects give it exposure to both colocation and enterprise upgrades.
Other players operating in the Australia data centre power market include ABB, Siemens, Cummins, Caterpillar, and Legrand, alongside local switchboard makers, generator dealers, battery integrators, electrical contractors and service providers supplying UPS, switchgear, generators and storage to hyperscale, colocation, enterprise and edge facilities across Australia.
Competition rests on local service coverage, factory lead times, operator approvals and tested modular power rooms delivered to tight schedules rather than on equipment price alone.


Upto 15% Off
AUD
$2749 $2499
$3849 $3499
$4949 $4499
$6049 $5499


*While we strive to always give you current and accurate information, the numbers depicted on the website are indicative and may differ from the actual numbers in the main report. At Expert Market Research, we aim to bring you the latest insights and trends in the market. Using our analyses and forecasts, stakeholders can understand the market dynamics, navigate challenges, and capitalize on opportunities to make data-driven strategic decisions.*
The Australia data centre power market is valued at AUD 1180.00 million in 2025, supported by a national data centre pipeline, a long transmission connection queue and the shift towards dense AI halls, with New South Wales as the largest region.
The market is forecast to reach AUD 3664.90 million by 2035, growing at a CAGR of 12.00 % over the 2026 to 2035 period, driven by hyperscale and colocation expansion, federal expectations on renewable supply and demand flexibility, and the move to lithium-ion storage and modular power rooms.
Batteries and Energy Storage records the highest CAGR at an estimated 16.2% through 2035, as lithium-ion systems replace lead-acid UPS blocks and operators respond to federal expectations on demand flexibility.
New South Wales dominates, with over half of the new transmission connection capacity reported by AEMO in July 2026. Queensland is the fastest-growing region at an estimated 14.8% CAGR, helped by large campus proposals.
Key players include Vertiv, Rehlko, Eaton, Schneider Electric, ABB, Siemens, Cummins, Caterpillar, and Legrand.
They are guidance released by the Australian Government in March 2026 covering national interest, energy, water, workforce and innovation. New facilities should underwrite renewable generation, pay their share of network costs and offer demand flexibility.
AEMO reported 9 GW of data centres in the transmission connection process in July 2026, and its August 2026 forecast found that more than 40% of projects had dropped out or moved backward since 2025.
Explore our key highlights of the report and gain a concise overview of key findings, trends, and actionable insights that will empower your strategic decisions.
| REPORT FEATURES | DETAILS |
| Base Year | 2025 |
| Historical Period | 2019-2025 |
| Forecast Period | 2026-2035 |
| Scope of the Report |
Historical and Forecast Trends, Industry Drivers and Constraints, Historical and Forecast Market Analysis by Segment:
|
| Breakup by Equipment Type |
|
| Breakup by Data Center Type |
|
| Breakup by Facility Capacity |
|
| Breakup by Region |
|
| Market Dynamics |
|
| Competitive Landscape |
|
| Companies Covered |
|
Datasheet
AUD 2,749
AUD 2,499
tax inclusive*
Single User License
AUD 3,849
AUD 3,499
tax inclusive*
Five User License
AUD 4,949
AUD 4,499
tax inclusive*
Corporate License
AUD 6,049
AUD 5,499
tax inclusive*
*Please note that the prices mentioned below are starting prices for each bundle type. Kindly contact our team for further details.*
Flash Bundle
Small Business Bundle
Growth Bundle
Enterprise Bundle
*Please note that the prices mentioned below are starting prices for each bundle type. Kindly contact our team for further details.*
Flash Bundle
Number of Reports: 3
20%
tax inclusive*
Small Business Bundle
Number of Reports: 5
25%
tax inclusive*
Growth Bundle
Number of Reports: 8
30%
tax inclusive*
Enterprise Bundle
Number of Reports: 10
35%
tax inclusive*
How To Order

Select License Type
Choose the right license for your needs and access rights.

Click on ‘Buy Now’
Add the report to your cart with one click and proceed to register.

Select Mode of Payment
Choose a payment option for a secure checkout. You will be redirected accordingly.
Strategic Solutions for Informed Decision-Making
Stay upgraded and grab opportunities by strategic insights
Stay informed and aware for a Market Leverage
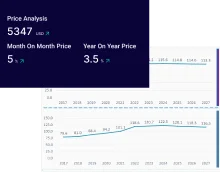
Analyze pricing patterns with comprehensive trend analyses.
Analyse trade data for supply chain insights.
Leverage cost reports for smart savings
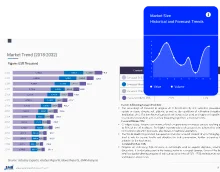
Elevate supply chain with collaboration
Contact Us for Further Information
Our specialized analysts will be available to answer all the pre-purchase and post-purchase queries regarding the report.
Our specialized analysts will be available to answer all the pre-purchase and post-purchase queries regarding the report.
Staying one step ahead of the market landscape with our in-depth research methods, integrating advanced analytics to drive precise and tangible outcomes.
Our expert analyst team offers a significant advantage over competitors, with extensive market insights into the latest trends, putting you strategically ahead.
We deliver a simplified yet extensive report, comprising in-depth industry insights and analytics tailored to your industry requirements.
We are happy to help you navigate through the services we offer and solve your queries.
Contact us