Consumer Insights
Uncover trends and behaviors shaping consumer choices today
Procurement Insights
Optimize your sourcing strategy with key market data
Industry Stats
Stay ahead with the latest trends and market analysis.
The Australia data center water consumption market covers the spending on water supply, wastewater discharge, water treatment, recycled water connections, metering and cooling water systems that data centres need to remove heat from servers. Cooling towers, closed-loop liquid circuits and adiabatic units each draw on potable, recycled, harvested or bore water to keep facilities within safe operating temperatures.
In 2025, the market is valued at AUD 185.00 million and is forecast to grow at a CAGR of 11.80%, reaching AUD 564.40 million by 2035. Growth is driven by artificial intelligence workloads, a pipeline of about 90 facilities beyond the 162 already operating, and state rules that favour non-potable supply.
Compound Annual Growth Rate
11.8%
Value in AUD million
2026-2035
The Australia data center water consumption market is at an inflection point. Direct on-site use is small today, about 5.5 gigalitres a year, but the facilities now being approved are far larger, and water utilities are being asked to plan for them before cooling designs are fixed.
Three forces are shaping the market: state and federal rules that steer operators towards recycled and non-potable water; a shift from evaporative towers to closed-loop and liquid cooling; and utility pricing reviews that make large users fund the infrastructure they require.
In December 2025 the Water Services Association of Australia published its data centre water resource, in March 2026 the Australian Government issued national expectations, and in August 2026 NSW released data centre guidelines while Victoria finalised a sustainable data centre action plan.
The market is moving from drinking-water evaporative cooling sold on cost towards recycled supply, closed-loop designs and metered, reported consumption. Potable supply and evaporative towers still lead because most existing capacity in Sydney, Melbourne and Brisbane was built around them, while recycled water, liquid cooling and hyperscale campuses advance fastest as approvals tighten. New South Wales remains the largest base, and Western Australia grows quickest from a smaller one. Federal expectations, state action plans and utility pricing reviews underpin a durable, multi-year outlook in which design choices made at approval set water demand for decades rather than a cyclical uplift.
| Metric | Value |
| Market Size 2025 | AUD 185.00 million |
| Projected Market Size 2035 | AUD 564.40 million |
| CAGR 2026 to 2035 | 11.80% |
| Fastest-Growing Water Source | Recycled Water: 15.1% CAGR |
| Fastest-Growing Cooling Technology | Closed-Loop Liquid Cooling: 13.4% CAGR |
| Largest Revenue Segment 2025 | Potable Water |
| Dominant Region | New South Wales |
| Highest CAGR by Region | Western Australia: 12.9% |
| Direct data centre water use in Australia | About 5.5 gigalitres a year |
Cooling Choices Lock In Water Demand
Revenue is set to rise from AUD 185.00 million in 2025 to AUD 564.40 million in 2035 at an 11.8% CAGR, as approved designs fix consumption for decades.
Recycled Water and Liquid Cooling Lead Growth
Potable supply remains the largest source, but recycled water grows at an estimated 15.1% CAGR and closed-loop liquid cooling at 13.4% through 2035, driven by state non-potable rules.
Victoria and NSW Set the Regulatory Template
Victoria's August 2026 action plan and the NSW guidelines with an IPART pricing review give operators the clearest design targets and cost rules in the country.
| Report Summary | Unit | Value |
| Base Year | AUD million | 2025 |
| Historical Period | AUD million | 2019 to 2025 |
| Forecast Period | AUD million | 2026 to 2035 |
| Market Size 2025 | AUD million | 185.00 |
| Market Size 2035 | AUD million | 564.40 |
| CAGR 2026 to 2035 | Percentage | 11.80 % |
| CAGR by Water Source: Recycled Water | Percentage | 15.1 % |
| CAGR by Cooling Technology: Closed-Loop Liquid Cooling | Percentage | 13.4 % |
| CAGR by Data Center Type: Hyperscale Data Centers | Percentage | 12.6 % |
| CAGR by Region: Western Australia | Percentage | 12.9 % |
| Direct Data Centre Water Use 2025 | Gigalitres | 5.5 |
| Operational Data Centres in Australia | Number | 162 |
| Market Share by Region 2025 | New South Wales | Dominant Share |
Cooling choices made at approval, state rules favouring non-potable supply and rapid capacity growth shape demand. Recycled supply and liquid cooling advance fastest while evaporative towers stay dominant.
The Australia data center water consumption market is being reshaped by state design targets, council limits on drinking water, recycled supply for cooling and national expectations.
September 2026 - Victoria Sets Water Targets for New Data Centres
August 2026 - Toowoomba Council Moves to Bar Drinking Water for Data Centres
June 2026 - Greater Western Water Supplies Recycled Water to AWS
March 2026 - Australian Government Issues Data Centre Expectations
Policy is moving from guidance to design targets, with recycled water connections and drought-ready cooling becoming expected rather than optional across the major data centre states.
Recent developments, presented from the most recent, show the Australia data center water consumption market moving from utility pricing reviews and operator disclosures into approvals and national guidance.
September 2026 - NSW Asks IPART to Review Data Centre Water Pricing
August 2026 - NEXTDC Reports Higher Water Usage Effectiveness
July 2026 - NSW Approves Goodman's Project Pluto in Western Sydney
December 2025 - WSAA Calls for National Data Centre Water Standards
Recent events show approvals, pricing reviews and operator disclosures converging, giving the market firmer evidence on water efficiency and the cost of serving large cooling loads.
The Expert Market Research’s report on the Australia Data Center Water Consumption Market offers a detailed analysis of the market based on the following segments.
Market Breakup by Water Source
Potable Water leads because most existing Sydney, Melbourne and Brisbane facilities connect to the drinking network, and data centres take about 0.7% of Sydney supply according to Data Centres Australia. Recycled Water grows fastest at an estimated 15.1% CAGR through 2035, after Greater Western Water agreed in June 2026 to supply Melton recycled water to an Amazon Web Services facility. Rainwater and Stormwater Harvesting is small but rising, as Goodman's Project Pluto includes a 60,000-litre rainwater tank. Groundwater and Bore Water is constrained by licensing, with Water Corporation cutting Gnangara Mound use by 30 billion litres from 2028. Others cover tankered and desalinated supply.
Market Breakup by Cooling Technology
Evaporative Cooling Towers lead because they are the cheapest option in Australia's climate, and NSW approved Goodman's open-tower Project Pluto in July 2026. Closed-Loop Liquid Cooling grows fastest at an estimated 13.4% CAGR, as CDC Data Centres announced a Maddington campus in August 2025 designed for zero water consumption in primary cooling. Adiabatic and Hybrid Cooling suits sites with limited non-potable supply, while Air-Cooled Chillers and Dry Coolers avoid on-site water but raise electricity use, as the University of Melbourne noted in July 2026. Others include immersion and direct-to-chip loops with coolant distribution units.
Market Breakup by Data Center Type
Colocation Data Centers lead because operators such as NEXTDC, which reported 740.1MW of contracted utilisation in August 2026, concentrate many tenants on shared cooling plant. Hyperscale Data Centers grow fastest at an estimated 12.6% CAGR, with AirTrunk announcing its AUD 5 billion MEL2 campus in December 2025 and Amazon Web Services securing recycled water in June 2026. Enterprise and Government Data Centers grow slowest as workloads migrate to shared facilities. Edge and Regional Data Centers expand in places such as Toowoomba, where council moved to bar drinking water use in August 2026.
Market Breakup by Region
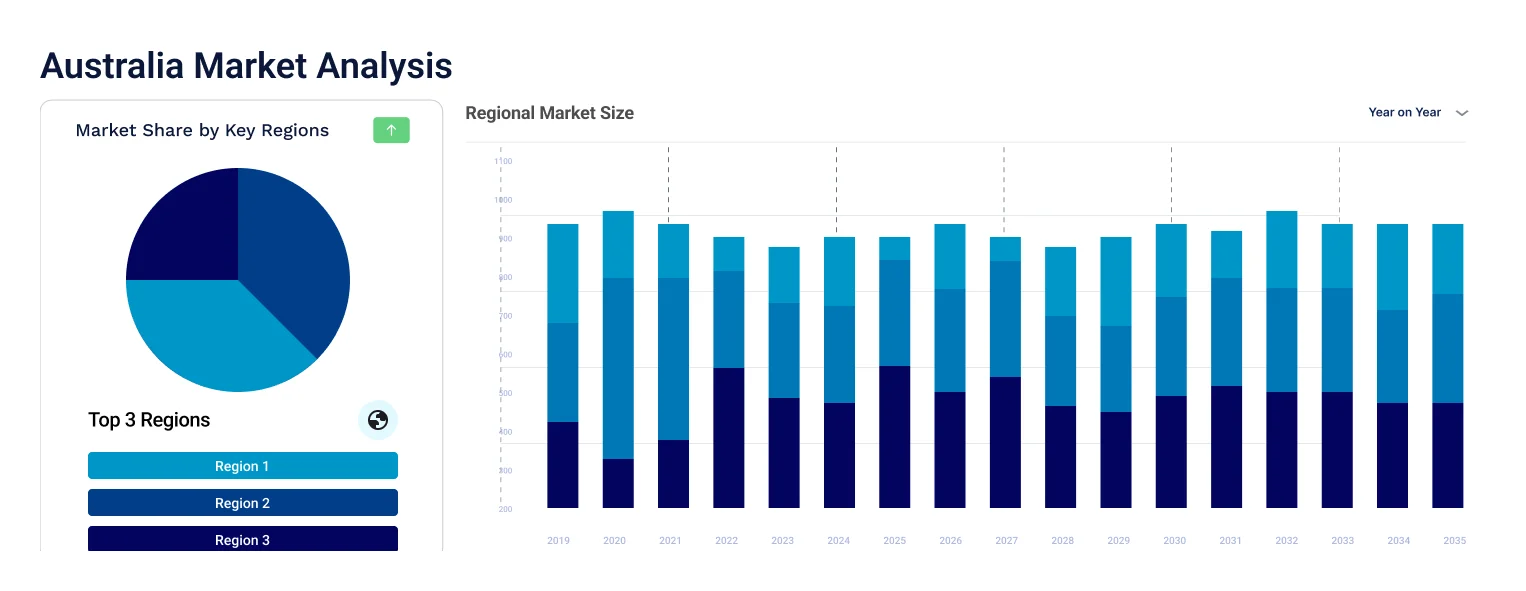
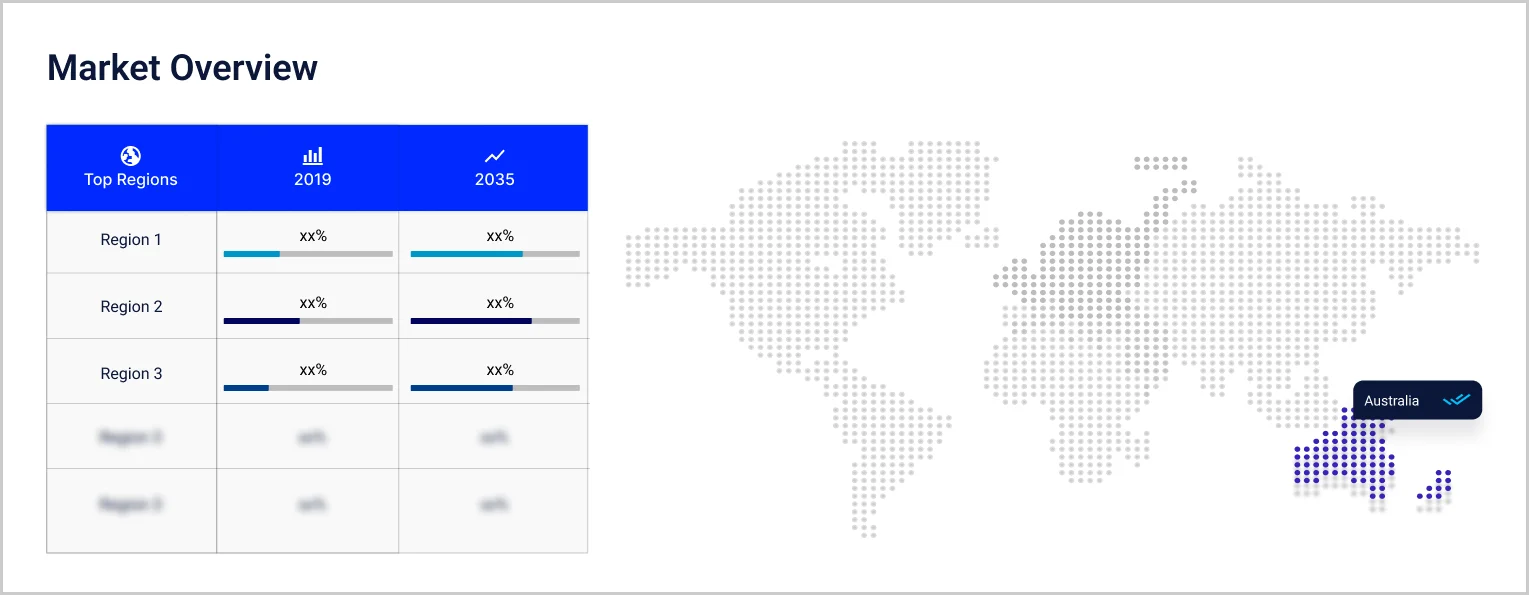
New South Wales dominates, with 19 State Significant Development data centre projects worth AUD 50.3 billion in the pipeline in August 2026, and grows at an estimated 11.0% CAGR as the IPART review raises cost clarity. Western Australia is fastest at an estimated 12.9%, helped by CDC's AUD 415 million Maddington stage and Water Corporation's doubling of the Kwinana recycling plant. Victoria grows at 12.4% on the September 2026 action plan, Queensland at 12.0% as Toowoomba tightens rules, and South Australia at 11.5%. Others, covering Tasmania, the ACT and the Northern Territory, grows at 11.4%, with the ACT drafting a framework for early 2027.
| CAGR 2026 to 2035, Market by Region | Growth Rate |
| New South Wales | 11.0 % |
| Victoria | 12.4 % |
| Queensland | 12.0 % |
| Western Australia | 12.9 % |
| South Australia | 11.5 % |
| Others (incl. Tasmania, Australian Capital Territory and Northern Territory) | 11.4 % |
Competition combines Australian colocation specialists, global hyperscale developers and property-led builders. Entry barriers include approvals speed, access to recycled or non-potable supply, power connections and the ability to publish credible water usage effectiveness data to utilities and regulators.
NEXTDC
NEXTDC, headquartered in Brisbane, was founded in 2010 by Bevan Slattery and has been listed on the ASX since December 2010, operating data centres in Sydney, Melbourne, Brisbane, Perth, Adelaide, Canberra and Darwin. Its FY26 results on 27 August 2026 showed contracted utilisation of 740.1MW. It reported water usage effectiveness of 2.40 litres per kilowatt-hour for the year to June 2026, up from 2.25, citing new capacity and meter reconciliation.
CDC Data Centres
CDC Data Centres is a Canberra-based operator running four Canberra campuses with eight data centres. In August 2025 it announced a AUD 415 million first stage at Maddington, Western Australia, a campus of up to 200MW with liquid cooling and a closed-loop system described as zero water consumption for primary cooling. In September 2026 it lodged a AUD 200 million Beard 2 application in Canberra with water-efficient closed-loop cooling.
AirTrunk
AirTrunk was founded by Robin Khuda and is owned by Blackstone after its A$24 billion acquisition, building hyperscale campuses across Australia and Asia. In December 2025 it announced more than AUD 5 billion of new investment in MEL2 in Melbourne's north-west, with over 354MW. That lifts its Australian platform to five campuses and over 1.2GW, so its cooling and water sourcing choices carry weight with Melbourne and Sydney utilities.
Goodman Group
Goodman Group, headquartered in Sydney, was founded in 1989, is listed on the ASX as GMG and develops logistics property and data centres. In July 2026 NSW approved its AUD 1.11 billion, 68MW Project Pluto at Guildford West, using water-cooled chillers with open cooling towers. The design adds a 60,000-litre rainwater tank and water-side economisation, which Goodman estimates cut potable amenity water demand by about 43%.
Other players operating in the Australia data center water consumption market include Equinix, Digital Realty, Global Switch, Macquarie Technology Group, and Amazon Web Services, alongside water utilities, cooling equipment suppliers, water treatment contractors and metering providers supporting data centre operators across Australia.
Competition turns on cooling design, water sourcing agreements and approvals speed rather than price, favouring operators that secure recycled supply and publish credible efficiency data.


Upto 15% Off
AUD
$2749 $2499
$3849 $3499
$4949 $4499
$6049 $5499


*While we strive to always give you current and accurate information, the numbers depicted on the website are indicative and may differ from the actual numbers in the main report. At Expert Market Research, we aim to bring you the latest insights and trends in the market. Using our analyses and forecasts, stakeholders can understand the market dynamics, navigate challenges, and capitalize on opportunities to make data-driven strategic decisions.*
The Australia data center water consumption market is valued at AUD 185.00 million in 2025, supported by artificial intelligence capacity growth, state rules favouring non-potable supply and the shift to closed-loop cooling, with New South Wales as the largest base.
The market is forecast to reach AUD 564.40 million by 2035, growing at a CAGR of 11.80 % over the 2026 to 2035 period, driven by recycled water connections, liquid cooling adoption and utility pricing reviews that make large users fund their own infrastructure.
Recycled Water records the highest CAGR at an estimated 15.1% through 2035, as state rules steer cooling towards non-drinking supply and plants such as Melton in Victoria connect their first data centre customers.
New South Wales dominates, supported by the largest data centre pipeline and Sydney Water's growing connection requests. Western Australia is the fastest-growing state at an estimated 12.9% CAGR, helped by CDC's Maddington campus.
Key players include NEXTDC, CDC Data Centres, AirTrunk, Goodman Group, Equinix, Digital Realty, Global Switch, Macquarie Technology Group, and Amazon Web Services.
It is the litres of water used per kilowatt-hour of energy. NEXTDC reported 2.40 for the year to June 2026, while Victoria's action plan sets design targets of 1.0 or lower for potable water and 1.6 or lower for non-potable water.
The Australian Government's March 2026 expectations ask developers to use efficient cooling, non-potable water and transparent reporting. Victoria's August 2026 plan sets water targets, and NSW asked IPART in 2026 to review data centre water pricing.
Explore our key highlights of the report and gain a concise overview of key findings, trends, and actionable insights that will empower your strategic decisions.
| REPORT FEATURES | DETAILS |
| Base Year | 2025 |
| Historical Period | 2019-2025 |
| Forecast Period | 2026-2035 |
| Scope of the Report |
Historical and Forecast Trends, Industry Drivers and Constraints, Historical and Forecast Market Analysis by Segment:
|
| Breakup by Water Source |
|
| Breakup by Cooling Technology |
|
| Breakup by Data Center Type |
|
| Breakup by Region |
|
| Market Dynamics |
|
| Competitive Landscape |
|
| Companies Covered |
|
Datasheet
AUD 2,749
AUD 2,499
tax inclusive*
Single User License
AUD 3,849
AUD 3,499
tax inclusive*
Five User License
AUD 4,949
AUD 4,499
tax inclusive*
Corporate License
AUD 6,049
AUD 5,499
tax inclusive*
*Please note that the prices mentioned below are starting prices for each bundle type. Kindly contact our team for further details.*
Flash Bundle
Small Business Bundle
Growth Bundle
Enterprise Bundle
*Please note that the prices mentioned below are starting prices for each bundle type. Kindly contact our team for further details.*
Flash Bundle
Number of Reports: 3
20%
tax inclusive*
Small Business Bundle
Number of Reports: 5
25%
tax inclusive*
Growth Bundle
Number of Reports: 8
30%
tax inclusive*
Enterprise Bundle
Number of Reports: 10
35%
tax inclusive*
How To Order

Select License Type
Choose the right license for your needs and access rights.

Click on ‘Buy Now’
Add the report to your cart with one click and proceed to register.

Select Mode of Payment
Choose a payment option for a secure checkout. You will be redirected accordingly.
Strategic Solutions for Informed Decision-Making
Stay upgraded and grab opportunities by strategic insights
Stay informed and aware for a Market Leverage
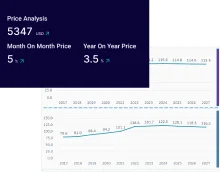
Analyze pricing patterns with comprehensive trend analyses.
Analyse trade data for supply chain insights.
Leverage cost reports for smart savings
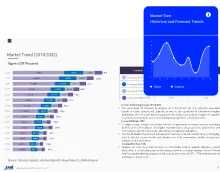
Elevate supply chain with collaboration
Contact Us for Further Information
Our specialized analysts will be available to answer all the pre-purchase and post-purchase queries regarding the report.
Our specialized analysts will be available to answer all the pre-purchase and post-purchase queries regarding the report.
Staying one step ahead of the market landscape with our in-depth research methods, integrating advanced analytics to drive precise and tangible outcomes.
Our expert analyst team offers a significant advantage over competitors, with extensive market insights into the latest trends, putting you strategically ahead.
We deliver a simplified yet extensive report, comprising in-depth industry insights and analytics tailored to your industry requirements.
We are happy to help you navigate through the services we offer and solve your queries.
Contact us