Consumer Insights
Uncover trends and behaviors shaping consumer choices today
Procurement Insights
Optimize your sourcing strategy with key market data
Industry Stats
Stay ahead with the latest trends and market analysis.
The New Zealand e-commerce market covers consumer purchases of physical goods and related retail services that are ordered over the internet or through mobile apps from domestic retailers, online marketplaces, brand stores and overseas sellers, then delivered to the home or collected in store. A small, widely spread population, long distances between cities and a strong habit of buying from Australia and Asia make online channels especially important.
In 2025, the market is valued at USD 5.20 billion and is forecast to grow at a CAGR of 7.20%, reaching USD 10.42 billion by 2035. Growth is driven by retailers lifting online share, with The Warehouse Group reporting in May 2026 that online made up 6.8% of its quarterly sales, and by Briscoe Group reporting online at 19.6% of first-half sales in September 2026.
Compound Annual Growth Rate
7.2%
Value in USD billion
2026-2035
The New Zealand e-commerce market is growing through a mix of local retailer investment and fierce offshore competition. Household budgets remain tight, so shoppers compare prices across marketplaces, retailer websites and overseas platforms before they buy, and store traffic keeps shifting online.
Three forces are shaping the market: omnichannel retailers using stores as collection and returns points, with Kmart promoting click and collect at its new Westgate store; rapid growth of cross-border platforms such as Temu; and a reset at some pure online players, as Mighty Ape cleared stock and changed management.
In February 2026 Mighty Ape reported a 25% fall in half-year revenue to NZ$65.2 million, and in August 2026 Trade Me named Kul Singh Kargil as chief executive. In September 2026 Briscoe Group reported record first-half sales and The Warehouse Group returned to an operating profit.
The market is moving from simple web stores towards connected shopping in which marketplaces, retailer apps, delivery options and store collection work together. Electronics and appliances lead in value because of high basket sizes, while health, beauty and personal care grows fastest as shoppers buy repeat items online. Retailer-owned websites and apps remain the largest platforms, yet cross-border marketplaces advance quickest on low prices. Home delivery stays dominant, but click and collect gains share as retailers invest in larger stores. Auckland remains the largest region, and the rest of New Zealand grows quickest as online shopping closes gaps in local store choice. Marketplace safety rules and retailer investment point to a durable shift in channel mix rather than a short cycle.
| Metric | Value |
| Market Size 2025 | USD 5.20 billion |
| Projected Market Size 2035 | USD 10.42 billion |
| CAGR 2026 to 2035 | 7.20% |
| Fastest-Growing Product Category | Health, Beauty and Personal Care: 8.6% CAGR |
| Fastest-Growing Platform Type | Cross-Border Marketplaces: 9.6% CAGR |
| Largest Revenue Segment 2025 | Electronics and Appliances |
| Dominant Region | Auckland |
| Highest CAGR by Region | Rest of New Zealand: 8.0% |
| Online share of Briscoe Group first-half sales, 2026 | 19.6% |
Retailer Investment Anchors Online Growth
Revenue is on course to roughly double across the decade, from USD 5.20 billion in 2025 to USD 10.42 billion in 2035 at a 7.2% CAGR. The Warehouse Group lifted online sales by 5.4% in its third quarter, and Briscoe Group's online sales reached NZ$73.4 million in its first half.
Cross-Border and Beauty Categories Lead Growth
Electronics and Appliances hold the largest share, but Health, Beauty and Personal Care grows at an estimated 8.6% CAGR and Cross-Border Marketplaces at an estimated 9.6% CAGR through 2035. Temu-type platforms grew 33% in one year, according to NZ Post data cited in February 2025.
Stores Become Fulfilment Hubs
Retailers are using physical networks to speed delivery and returns, so click and collect grows fastest among fulfilment methods. Large stores now double as pickup points, and trading remains cautious.
| Report Summary | Unit | Value |
| Base Year | USD billion | 2025 |
| Historical Period | USD billion | 2019 to 2025 |
| Forecast Period | USD billion | 2026 to 2035 |
| Market Size 2025 | USD billion | 5.20 |
| Market Size 2035 | USD billion | 10.42 |
| CAGR 2026 to 2035 | Percentage | 7.20 % |
| CAGR by Product Category: Health, Beauty and Personal Care | Percentage | 8.6 % |
| CAGR by Platform Type: Cross-Border Marketplaces | Percentage | 9.6 % |
| CAGR by Fulfilment Method: Click and Collect | Percentage | 8.4 % |
| CAGR by Region: Rest of New Zealand | Percentage | 8.0 % |
| Briscoe Group First-Half Online Sales 2026 | Million NZD | 73.40 |
| Mighty Ape Half-Year Revenue 2025 to 2026 | Million NZD | 65.20 |
| Market Share by Region 2025 | Auckland | Dominant Share |
Online retail is taking share from stores as retailers blend delivery with collection, while offshore platforms add price pressure. Auckland leads, and the rest of the country grows fastest.
The New Zealand e-commerce market is being reshaped by retailer profit recovery, strong omnichannel sales, soft household spending and rapid growth of low-price overseas platforms.
September 2026 - Warehouse Group Returns to Operating Profit as Noel Leeming Leads
September 2026 - Briscoe Group Reports Record First-Half Sales with Online at 19.6%
August 2026 - Stats NZ Reports Retail Card Spending Fell 0.9% in August
February 2025 - NZ Post Data Shows Temu-Type Platforms Up 33% in One Year
Retailer profit recovery, steady growth of online share and cautious household spending are the main forces, while price-led overseas platforms remain the main competitive risk for local sellers.
Recent developments, presented from the most recent, show larger omnichannel stores, leadership change at Trade Me, rising online share at The Warehouse Group and a reset at Mighty Ape.
September 2026 - Kmart Opens Its Largest New Zealand Store at Westgate
August 2026 - Trade Me Names New Chief Executive and Backs Scam Protections
May 2026 - Warehouse Group Online Sales Rise 5.4% in Third Quarter
February 2026 - Mighty Ape Revenue Falls 25% as Parent Kogan Resets Operations
Larger omnichannel stores, leadership change at a leading marketplace and a stock reset at a pure online retailer show the sector adapting to cautious shoppers and tougher competition.
The Expert Market Research’s report on the New Zealand E-commerce Market offers a detailed analysis of the market based on the following segments.
Market Breakup by Product Category
Electronics and Appliances lead in value, in our estimate, as Noel Leeming drove Warehouse Group online growth of 5.4% in the quarter to May 2026 and planned an Auckland flagship. Fashion and Apparel faces heavy price competition from overseas platforms. Home, Furniture and Garden gains from Kmart's 6,700 sq metre Westgate store opened in September 2026, and Briscoes reported online at 19.6% of first-half sales that month. Health, Beauty and Personal Care grows fastest at an estimated 8.6% CAGR through 2035, with Kmart placing beauty at its entrance. Toys, Media and Hobby Goods draws on specialist sellers such as Mighty Ape, and Others cover groceries and pet supplies.
Market Breakup by Platform Type
Retailer-Owned Websites and Apps lead, in our estimate, because The Warehouse Group, Briscoe Group and Kmart route growing shares of sales through their own channels. Domestic Online Marketplaces include Trade Me, which named a new chief executive in August 2026, and Mighty Ape's marketplace, which contributed more in its half-year to December 2025. Cross-Border Marketplaces grow fastest at an estimated 9.6% CAGR through 2035, after Temu-type platforms rose 33% according to NZ Post data cited in February 2025. Brand Direct Stores grow steadily as makers sell directly to shoppers.
Market Breakup by Fulfilment Method
Home Delivery leads, in our estimate, because most orders from domestic retailers and marketplaces still go to the front door, including those placed with Noel Leeming and Mighty Ape. Click and Collect grows fastest at an estimated 8.4% CAGR through 2035, as Kmart's Westgate store, opened on 10 September 2026, lets customers collect in store or from their car. Cross-Border Parcel Delivery covers small shipments from overseas platforms, where average order values fell in the preceding year according to NZ Post data cited in February 2025. Others include parcel lockers and same-day courier services.
Market Breakup by Region
Auckland dominates, in our estimate, as the largest population centre and home to Mighty Ape in Silverdale, Kmart's Westgate store opened in September 2026 and Noel Leeming's planned Queen Street flagship, and it grows at an estimated 6.6% CAGR through 2035 from a large, mature base. Rest of New Zealand is the fastest-growing region at an estimated 8.0%, as smaller towns rely on online ranges. Waikato grows at 7.7% and Canterbury at 7.4%, both helped by regional distribution links. Wellington grows at 6.9%, supported by public sector households and the base of Trade Me.
| CAGR 2026 to 2035, Market by Region | Growth Rate |
| Auckland | 6.6 % |
| Wellington | 6.9 % |
| Canterbury | 7.4 % |
| Waikato | 7.7 % |
| Rest of New Zealand | 8.0 % |
Competition combines national chains, a leading domestic marketplace, a pure online retailer owned from Australia and overseas platforms. Entry barriers include fulfilment networks, supplier terms, marketplace trust and the cost of returns.
The Warehouse Group
The Warehouse Group, an Auckland-based retailer, operates The Warehouse, Warehouse Stationery and Noel Leeming, with online channels alongside stores. On 30 September 2026 it reported group sales of about NZ$3 billion and an operating profit of NZ$22.6 million, with Noel Leeming contributing NZ$21.8 million. In May 2026 it said online sales rose 5.4% and reached 6.8% of quarterly sales. Noel Leeming plans a flagship at 192 Queen Street, Auckland.
Trade Me
Trade Me, based in Wellington, runs New Zealand's best known online marketplace alongside property, motor and jobs classifieds. In August 2026 it announced that Kul Singh Kargil would take over as chief executive from Anders Skoe, who steps down at the end of September after seven years. It signed the New Zealand Online Scams Code in July 2026 and launched an artificial intelligence property search tool on 26 August 2026.
Mighty Ape
Mighty Ape, based in Silverdale north of Auckland, is a New Zealand online retailer and marketplace owned by Australia's Kogan. In August 2025 Kogan wrote down its investment by A$46.3 million after platform problems and weak consumer confidence. In February 2026 Mighty Ape reported half-year revenue down 25% to NZ$65.2 million, appointed Grant Henry as general manager, and launched car and pet insurance through Cove.
Briscoe Group
Briscoe Group, an Auckland-based retailer, operates Briscoes homeware and Rebel Sport, with strong websites alongside its store network. On 16 September 2026 it reported record first-half sales of NZ$374.2 million, up 0.79%, with online sales of NZ$73.4 million, or 19.6% of group sales. Net profit after tax eased 5.9% to NZ$27.6 million.
Other players operating in the New Zealand e-commerce market include Kmart New Zealand, PB Tech, Temu, Shein, and Amazon Australia, alongside specialist online retailers, grocery chains, brand direct stores, courier firms and small marketplace sellers serving shoppers across New Zealand.
Competition rests on delivery speed, price, ranges, marketplace trust and store networks that support collection and returns, while overseas platforms keep pressing on price.


Upto 15% Off
AUD
$2749 $2499
$3849 $3499
$4949 $4499
$6049 $5499


*While we strive to always give you current and accurate information, the numbers depicted on the website are indicative and may differ from the actual numbers in the main report. At Expert Market Research, we aim to bring you the latest insights and trends in the market. Using our analyses and forecasts, stakeholders can understand the market dynamics, navigate challenges, and capitalize on opportunities to make data-driven strategic decisions.*
The New Zealand e-commerce market is valued at USD 5.20 billion in 2025, supported by rising online share at national retailers, a wider choice of delivery and collection options and strong interest in overseas platforms, with Auckland as the largest region.
The market is forecast to reach USD 10.42 billion by 2035, growing at a CAGR of 7.20 % over the 2026 to 2035 period, driven by omnichannel investment, cautious household budgets, growth of cross-border marketplaces and safer marketplace trading.
Health, Beauty and Personal Care records the highest CAGR at an estimated 8.6% through 2035, as shoppers buy repeat items online and retailers such as Kmart give beauty more prominence.
Auckland dominates, as the largest population centre with major retail stores and online businesses. Rest of New Zealand is the fastest-growing region at an estimated 8.0% CAGR, as smaller towns rely more on online ranges.
Key players include The Warehouse Group, Trade Me, Mighty Ape, Briscoe Group, Kmart New Zealand, PB Tech, Temu, Shein, and Amazon Australia.
Click and collect lets shoppers order online and pick up in store or from their car. Kmart offers it at its Westgate store, opened on 10 September 2026, and it is the fastest-growing fulfilment method at an estimated 8.4% CAGR.
Briscoe Group reported on 16 September 2026 that online sales were NZ$73.4 million, equal to 19.6% of first-half group sales.
Explore our key highlights of the report and gain a concise overview of key findings, trends, and actionable insights that will empower your strategic decisions.
| REPORT FEATURES | DETAILS |
| Base Year | 2025 |
| Historical Period | 2019-2025 |
| Forecast Period | 2026-2035 |
| Scope of the Report |
Historical and Forecast Trends, Industry Drivers and Constraints, Historical and Forecast Market Analysis by Segment:
|
| Breakup by Product Category |
|
| Breakup by Platform Type |
|
| Breakup by Fulfilment Method |
|
| Breakup by Region |
|
| Market Dynamics |
|
| Competitive Landscape |
|
| Companies Covered |
|
Datasheet
AUD 2,749
AUD 2,499
tax inclusive*
Single User License
AUD 3,849
AUD 3,499
tax inclusive*
Five User License
AUD 4,949
AUD 4,499
tax inclusive*
Corporate License
AUD 6,049
AUD 5,499
tax inclusive*
*Please note that the prices mentioned below are starting prices for each bundle type. Kindly contact our team for further details.*
Flash Bundle
Small Business Bundle
Growth Bundle
Enterprise Bundle
*Please note that the prices mentioned below are starting prices for each bundle type. Kindly contact our team for further details.*
Flash Bundle
Number of Reports: 3
20%
tax inclusive*
Small Business Bundle
Number of Reports: 5
25%
tax inclusive*
Growth Bundle
Number of Reports: 8
30%
tax inclusive*
Enterprise Bundle
Number of Reports: 10
35%
tax inclusive*
How To Order

Select License Type
Choose the right license for your needs and access rights.

Click on ‘Buy Now’
Add the report to your cart with one click and proceed to register.

Select Mode of Payment
Choose a payment option for a secure checkout. You will be redirected accordingly.
Strategic Solutions for Informed Decision-Making
Stay upgraded and grab opportunities by strategic insights
Stay informed and aware for a Market Leverage
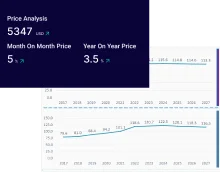
Analyze pricing patterns with comprehensive trend analyses.
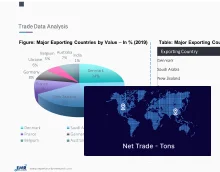
Analyse trade data for supply chain insights.
Leverage cost reports for smart savings
Elevate supply chain with collaboration
Contact Us for Further Information
Our specialized analysts will be available to answer all the pre-purchase and post-purchase queries regarding the report.
Our specialized analysts will be available to answer all the pre-purchase and post-purchase queries regarding the report.
Staying one step ahead of the market landscape with our in-depth research methods, integrating advanced analytics to drive precise and tangible outcomes.
Our expert analyst team offers a significant advantage over competitors, with extensive market insights into the latest trends, putting you strategically ahead.
We deliver a simplified yet extensive report, comprising in-depth industry insights and analytics tailored to your industry requirements.
We are happy to help you navigate through the services we offer and solve your queries.
Contact us