Consumer Insights
Uncover trends and behaviors shaping consumer choices today
Procurement Insights
Optimize your sourcing strategy with key market data
Industry Stats
Stay ahead with the latest trends and market analysis.
The Australia payments market covers the revenue earned from accepting, routing and settling payments for Australian businesses, including merchant service fees on cards, real-time and account-to-account transfers, digital wallets, buy now pay later merchant fees, gateway and terminal services, and the fraud and compliance tools around them. Value is measured as provider revenue, not as the amount of money moved.
In 2025, the market is valued at AUD 12.00 billion and is forecast to grow at a CAGR of 6.40%, reaching AUD 22.32 billion by 2035. Growth is driven by the shift from cash to cards and wallets, rapid uptake of real-time bank transfers, online commerce, and a reform agenda that is lowering card costs while raising standards on scams and licensing.
Compound Annual Growth Rate
6.4%
Value in AUD billion
2026-2035
The Australia payments market is changing from a card-dominated fee pool towards a more diverse mix of cards, wallets, real-time bank transfers and instalment products. Merchants are choosing providers on cost transparency, routing choice and fraud protection as well as on price.
Three forces are shaping demand: regulation that removes card surcharges and lowers interchange; steady growth in debit, wallet and real-time transfers as cash declines; and online and business-to-business payments moving onto application programming interfaces, embedded finance and account-based rails.
In March 2026 the Reserve Bank of Australia concluded its merchant card cost review, in May 2026 the Government released draft scams rules for banks, and in August 2026 the Commonwealth Bank cut its in-store merchant fee ahead of the 1 October 2026 surcharge ban.
The market is moving from a fee pool anchored on credit card interchange and surcharges towards a broader base of lower-priced debit, wallet and account-based payments. Cards remain the largest revenue segment because of the scale of everyday spending, while real-time and account-to-account payments, online gateways and business-to-business billing advance fastest as businesses look for lower cost and better fraud control. New South Wales remains the largest base and Queensland grows quickest from a smaller one. Reserve Bank decisions on surcharging, interchange and foreign cards, scam obligations and payment licensing reform shape a multi-year outlook in which volume growth is partly offset by lower unit fees, rewarding scale, routing flexibility and embedded services.
| Metric | Value |
| Market Size 2025 | AUD 12.00 billion |
| Projected Market Size 2035 | AUD 22.32 billion |
| CAGR 2026 to 2035 | 6.40% |
| Fastest-Growing Payment Method | Real-Time and Account-to-Account Payments: 14.8% CAGR |
| Fastest-Growing Service Type | Payment Gateways and Online Payment Services: 9.6% CAGR |
| Largest Revenue Segment 2025 | Cards (Debit and Credit) |
| Dominant Region | New South Wales |
| Highest CAGR by Region | Queensland: 7.4% |
| Estimated annual merchant savings from card reforms | About AUD 910 million |
Reform Reshapes the Fee Pool
Revenue is set to rise from AUD 12.00 billion in 2025 to AUD 22.32 billion in 2035 at a 6.4% CAGR, as higher volumes outweigh lower card fees after the October 2026 surcharge ban.
Real-Time Payments Lead Growth
Cards remain the largest segment, but real-time and account-to-account payments grow at an estimated 14.8% CAGR and payment gateways and online services at 9.6% through 2035.
Scam Rules and Licensing Raise the Bar
Draft scam obligations released in May 2026 and payments licensing bills released in March 2026 favour providers with strong fraud controls, which influences which firms win merchant and bank contracts.
| Report Summary | Unit | Value |
| Base Year | AUD billion | 2025 |
| Historical Period | AUD billion | 2019 to 2025 |
| Forecast Period | AUD billion | 2026 to 2035 |
| Market Size 2025 | AUD billion | 12.00 |
| Market Size 2035 | AUD billion | 22.32 |
| CAGR 2026 to 2035 | Percentage | 6.40 % |
| CAGR by Payment Method: Real-Time and Account-to-Account Payments | Percentage | 14.8 % |
| CAGR by Service Type: Payment Gateways and Online Payment Services | Percentage | 9.6 % |
| CAGR by End Use: Business-to-Business and Billers | Percentage | 8.3 % |
| CAGR by Region: Queensland | Percentage | 7.4 % |
| Estimated Annual Merchant Savings from Card Reforms | AUD million | 910 |
| Share of Merchants Currently Surcharging | Percentage | 16 % |
| Market Share by Region 2025 | New South Wales | Dominant Share |
Falling card costs, rising real-time transfers and stricter scam and licensing rules reshape spending. Real-time payments advance fastest while cards remain the largest revenue base.
The Australia payments market is being reshaped by the end of card surcharging, strong growth in real-time transfers, a slight rise in cash use and a major licensing reform.
October 2026- Card Surcharging Ends and Lower Interchange Applies
August 2026 - Real-Time Transfers Outpace Card Growth
May 2026 - Reserve Bank Survey Shows Cash Share Edging Up
March 2026 - Treasury Releases Payments Licensing Draft Legislation
Surcharge removal, rapid real-time transfer growth and licensing reform are pushing providers to compete on routing choice, transparency and fraud controls rather than on card fees alone.
Recent developments, presented from the most recent, show the Australia payments market moving from treasury and embedded finance launches towards agentic commerce and real-time biller payments.
August 2026 - Stripe Launches Treasury in Australia
August 2026 - Tyro and Zip Report Full-Year Growth
January 2026 - Mastercard Completes Australia's First Agentic Transactions
October 2025 - Westpac Rolls Out PayID Biller for Business
Recent events show providers launching treasury accounts, agentic checkout trials and real-time biller services, while listed payment firms report solid growth, giving merchants more choice but more complex vendor decisions.
The Expert Market Research’s report on the Australia Payments Market offers a detailed analysis of the market based on the following segments.
Market Breakup by Payment Method
Cards (Debit and Credit) lead because they made up 73% of payments by number in the Reserve Bank's 2025 survey, and Australian Payments Plus cut eftpos wholesale fees by 22% in May 2025. Real-Time and Account-to-Account Payments grow fastest at an estimated 14.8% CAGR, as the New Payments Platform processed AUD 262.7 billion in August 2026 and NAB launched PayTo at Amazon.com.au in January 2025. Digital Wallets rise with device-based payments near 40% of card payments. Buy Now Pay Later is smaller, with Zip reporting AUD 16.7 billion of global volume in August 2026. Others cover cash-equivalent products, prepaid and cheques.
Market Breakup by Service Type
Merchant Acquiring and Processing leads because every card and wallet transaction carries a processing fee, and Tyro reported AUD 66.9 million of EBITDA in August 2026. Payment Gateways and Online Payment Services grow fastest at an estimated 9.6% CAGR, with Stripe launching Treasury in Australia in August 2026 and Tyro's eCommerce volumes up 25%. Terminals and Point-of-Sale Hardware follow the installed base of tap-to-pay devices. The Commonwealth Bank cut its in-store fee to 0.99% from October 2026. Fraud, Security and Compliance Services rise as Stripe Radar blocked more than AUD 2.4 billion of fraud in 2025 and scam rules approach.
Market Breakup by End Use
Retail and Hospitality lead because small merchants generate most in-person card volume and benefit most from the October 2026 surcharge ban, with Tyro adding Bakers Delight and other franchise customers in August 2026. E-commerce and Digital Services grow at an estimated 7.6% CAGR, helped by Stripe's local processing for international sales from August 2026. Business-to-Business and Billers grow fastest at an estimated 8.3%, as Westpac rolled out PayID Biller in October 2025 and Payday Super began in July 2026. Government and Utilities grow at a steadier 6.1% as billers move from BPAY to PayID and PayTo.
Market Breakup by Region
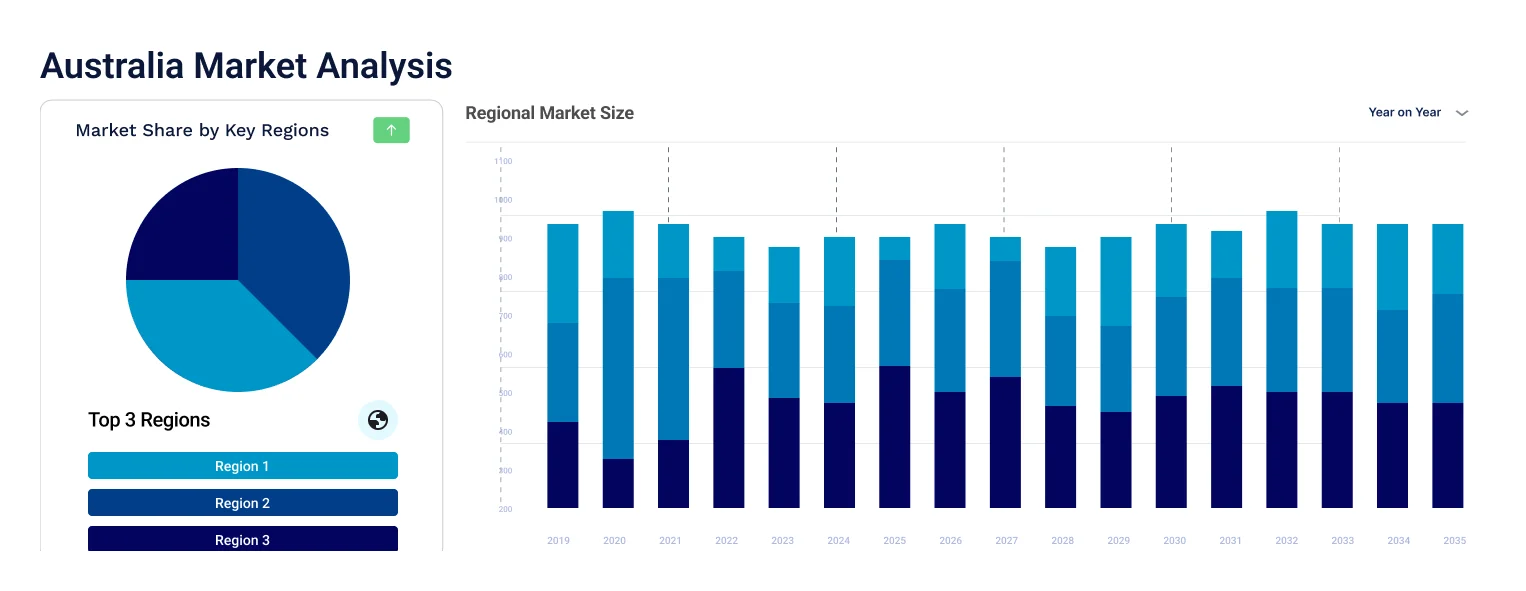
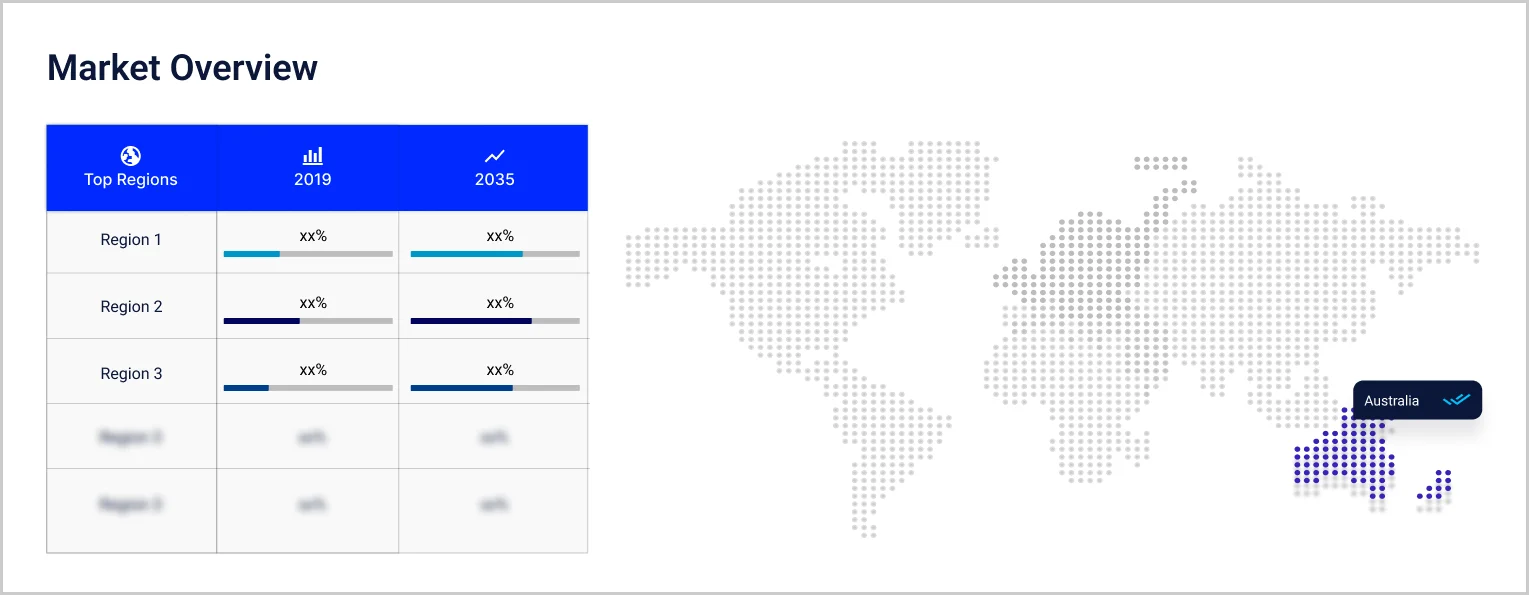
New South Wales dominates, as Sydney hosts the local operations of the Commonwealth Bank, Tyro, Zip and Westpac, and Stripe held its Australian showcase there in August 2026, so it grows at an estimated 6.0% CAGR from the largest base. Queensland is fastest at an estimated 7.4%, as tourism and small business spending move onto tap payments after the October 2026 surcharge ban. Western Australia grows at 7.0% on resource-linked business payments, and Victoria at 6.3%, where Huifu Payment opened its Australian headquarters in Melbourne in March 2025. Others, grouping South Australia, Tasmania, the ACT and the Northern Territory, grows at 6.2%.
| CAGR 2026 to 2035, Market by Region | Growth Rate |
| New South Wales | 6.0 % |
| Victoria | 6.3 % |
| Queensland | 7.4 % |
| Western Australia | 7.0 % |
| Others (incl. South Australia, Tasmania, Australian Capital Territory and Northern Territory) | 6.2 % |
Competition combines major banks, listed acquirers and buy now pay later providers, global gateways and card networks. Entry barriers include scheme and bank sponsorship, licensing and fraud capability, integration depth with point-of-sale and accounting software, and the ability to price profitably as interchange and surcharging change.
Commonwealth Bank
Commonwealth Bank of Australia is headquartered in Sydney and is the largest merchant acquirer among the major banks, supplying Smart terminals and a Single Rate Per Transaction plan. On 31 August 2026 it announced that its in-store merchant fee would fall from 1.1% to 0.99% from 1 October 2026 to ease the move away from surcharging. In January 2026 a CommBank debit card was used in Australia's first authenticated agentic Mastercard transaction.
Tyro
Tyro Payments is headquartered in Sydney and is an ASX-listed acquirer serving hospitality, retail, health and franchise merchants with integrated terminals, eCommerce and business banking. On 25 August 2026 it reported full-year gross profit up 5.3% to AUD 231.8 million, EBITDA up 8.6% to AUD 66.9 million and free cash flow up 49.5%. It is acquiring Thriday, and guided fiscal 2027 gross profit of AUD 240 million to AUD 255 million.
Zip
Zip Co is an ASX-listed buy now pay later provider headquartered in Sydney, offering Zip Pay and Zip Plus to consumers and merchants in Australia and the United States. On 20 August 2026 it reported total transaction volume of AUD 16.7 billion, revenue of AUD 1,336.1 million, cash EBTDA of AUD 268.9 million and 6.5 million active customers. It is winding down New Zealand operations to focus on Australia and guided to cash EBTDA of AUD 340 million.
Stripe
Stripe is headquartered in San Francisco and Dublin and supplies payment gateways, Billing, Radar fraud tools and Treasury to Australian businesses from its Sydney office. At Stripe Tour Sydney on 19 August 2026 it launched Treasury in Australia, with multi-currency accounts and payouts to nearly 100 countries. It said Stripe Billing powered more than 10 million active Australian subscriptions in 2025, and tens of thousands of new Australian businesses join each month.
Other players operating in the Australia payments market include Westpac, NAB, Mastercard, Block, and Australian Payments Plus, alongside Visa, ANZ, international gateways, specialist account-to-account fintechs and independent terminal providers serving merchants across Australia.
Competition turns on routing choice, fraud capability and integrated services rather than headline fees alone, favouring providers that can serve merchants across in-store, online and account-based payments.


Upto 15% Off
AUD
$2749 $2499
$3849 $3499
$4949 $4499
$6049 $5499


*While we strive to always give you current and accurate information, the numbers depicted on the website are indicative and may differ from the actual numbers in the main report. At Expert Market Research, we aim to bring you the latest insights and trends in the market. Using our analyses and forecasts, stakeholders can understand the market dynamics, navigate challenges, and capitalize on opportunities to make data-driven strategic decisions.*
The Australia payments market is valued at AUD 12.00 billion in 2025, supported by the shift from cash to cards and wallets, fast growth in real-time transfers and online commerce, with New South Wales as the largest base.
The market is forecast to reach AUD 22.32 billion by 2035, growing at a CAGR of 6.40 % over the 2026 to 2035 period, driven by real-time and account-to-account adoption, online gateways and business billing, partly offset by lower card fees after the surcharge ban.
Real-Time and Account-to-Account Payments record the highest CAGR at an estimated 14.8% through 2035, as the New Payments Platform value rose 27.9% year on year in August 2026.
New South Wales dominates, supported by Sydney's concentration of banks, acquirers and payment technology firms. Queensland is the fastest-growing region at an estimated 7.4% CAGR, helped by tourism and small business tap payments.
Key players include Commonwealth Bank, Tyro, Zip, Stripe, Westpac, NAB, Mastercard, Block, and Australian Payments Plus.
The Reserve Bank removed the right to surcharge eftpos, Mastercard and Visa debit, prepaid and credit card payments from 1 October 2026. It estimates merchants will save about AUD 910 million a year from lower wholesale costs.
Draft rules and codes released in May 2026 would require banks to govern, detect, report, disrupt and respond to scams. Most mandatory obligations are expected from 31 March 2027.
Explore our key highlights of the report and gain a concise overview of key findings, trends, and actionable insights that will empower your strategic decisions.
| REPORT FEATURES | DETAILS |
| Base Year | 2025 |
| Historical Period | 2019-2025 |
| Forecast Period | 2026-2035 |
| Scope of the Report |
Historical and Forecast Trends, Industry Drivers and Constraints, Historical and Forecast Market Analysis by Segment:
|
| Breakup by Payment Method |
|
| Breakup by Service Type |
|
| Breakup by End Use |
|
| Breakup by Region |
|
| Market Dynamics |
|
| Competitive Landscape |
|
| Companies Covered |
|
Datasheet
AUD 2,749
AUD 2,499
tax inclusive*
Single User License
AUD 3,849
AUD 3,499
tax inclusive*
Five User License
AUD 4,949
AUD 4,499
tax inclusive*
Corporate License
AUD 6,049
AUD 5,499
tax inclusive*
*Please note that the prices mentioned below are starting prices for each bundle type. Kindly contact our team for further details.*
Flash Bundle
Small Business Bundle
Growth Bundle
Enterprise Bundle
*Please note that the prices mentioned below are starting prices for each bundle type. Kindly contact our team for further details.*
Flash Bundle
Number of Reports: 3
20%
tax inclusive*
Small Business Bundle
Number of Reports: 5
25%
tax inclusive*
Growth Bundle
Number of Reports: 8
30%
tax inclusive*
Enterprise Bundle
Number of Reports: 10
35%
tax inclusive*
How To Order

Select License Type
Choose the right license for your needs and access rights.

Click on ‘Buy Now’
Add the report to your cart with one click and proceed to register.

Select Mode of Payment
Choose a payment option for a secure checkout. You will be redirected accordingly.
Strategic Solutions for Informed Decision-Making
Stay upgraded and grab opportunities by strategic insights
Stay informed and aware for a Market Leverage
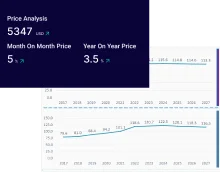
Analyze pricing patterns with comprehensive trend analyses.
Analyse trade data for supply chain insights.
Leverage cost reports for smart savings
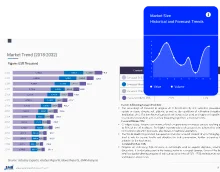
Elevate supply chain with collaboration
Contact Us for Further Information
Our specialized analysts will be available to answer all the pre-purchase and post-purchase queries regarding the report.
Our specialized analysts will be available to answer all the pre-purchase and post-purchase queries regarding the report.
Staying one step ahead of the market landscape with our in-depth research methods, integrating advanced analytics to drive precise and tangible outcomes.
Our expert analyst team offers a significant advantage over competitors, with extensive market insights into the latest trends, putting you strategically ahead.
We deliver a simplified yet extensive report, comprising in-depth industry insights and analytics tailored to your industry requirements.
We are happy to help you navigate through the services we offer and solve your queries.
Contact us