Consumer Insights
Uncover trends and behaviors shaping consumer choices today
Procurement Insights
Optimize your sourcing strategy with key market data
Industry Stats
Stay ahead with the latest trends and market analysis.
The Australia hyperscale data center market covers spending on large-scale facilities of tens to hundreds of megawatts, built by cloud providers or by hyperscale colocation developers, including construction and civil works, power systems, cooling plant and installed IT infrastructure. These campuses host cloud, artificial intelligence and sovereign workloads that cannot run efficiently in small enterprise rooms.
In 2025, the market is valued at AUD 11.50 billion in 2025 and is forecast to grow at a (CAGR) of 10.50%, reaching AUD 31.21 billion by 2035. Growth is driven by cloud and AI capacity commitments from global platforms, a record pipeline of grid connection applications and government expectations that tie new campuses to renewable energy and national interest outcomes.
Compound Annual Growth Rate
10.5%
Value in AUD billion
2026-2035
The Australia hyperscale data center market is shifting from cloud-region build-outs towards gigawatt-scale campuses designed for AI training and inference. Power access, not land or demand, now sets the pace and decides which projects proceed.
Three forces shape the market: platform commitments from Amazon Web Services and Microsoft that together exceed AUD 45 billion; a connection queue that AEMO measured at 67 GW of proposed capacity; and tightening state and federal rules on energy, water and sovereignty.
In December 2025, AirTrunk announced a Melbourne campus of more than 354 MW, and OpenAI and NEXTDC signed an agreement for a 650 MW Sydney campus. In March 2026, Canberra published national expectations for data centres, and in April 2026 Microsoft pledged AUD 25 billion.
The market is moving from conventional cloud halls towards liquid-cooled, power-dense campuses built for AI. Construction and civil works lead spending, while cooling systems advance fastest as rack densities climb. Wholesale colocation campuses dominate ownership, with sovereign AI campuses growing quickest, and cloud service providers remain the largest tenants. New South Wales is the largest state, while South Australia expands fastest from a small base. Grid access, state planning rules and tax certainty will decide timing, yet the multi-year outlook remains strong.
| Metric | Value |
| Market Size 2025 | AUD 11.50 billion |
| Projected Market Size 2035 | AUD 31.21 billion |
| CAGR 2026 to 2035 | 10.50% |
| Fastest-Growing Component | Cooling Systems: 13.6% CAGR |
| Fastest-Growing Ownership Model | Sovereign AI Campuses: 12.8% CAGR |
| Largest Revenue Segment 2025 | Construction and Civil Works |
| Dominant Region | New South Wales |
| Highest CAGR by Region | South Australia: 12.4% |
| Data centre projects in the AEMO connection process, August 2026 | 225 projects |
Platform and Colocation Capex Sustains Demand
Spending is on course to nearly triple across the decade, from AUD 11.50 billion in 2025 to AUD 31.21 billion in 2035 at a 10.5% CAGR. Cloud commitments, pre-leased colocation capacity and AI offtake agreements support recurring construction and fit-out demand.
Cooling and Sovereign Campuses Lead Growth
Construction and civil works remain the largest component, but cooling systems grow at an estimated 13.6% CAGR through 2035 as liquid cooling spreads. Sovereign AI campuses rise at 12.8% and AI and GPU cloud tenants at 12.1%.
OpenAI and NEXTDC Define the AI Campus Template
In December 2025, OpenAI and NEXTDC signed a memorandum of understanding for a sovereign AI campus at Eastern Creek in western Sydney, setting a template for offtaker-anchored builds.
| Report Summary | Unit | Value |
| Base Year | AUD billion | 2025 |
| Historical Period | AUD billion | 2019 to 2025 |
| Forecast Period | AUD billion | 2026 to 2035 |
| Market Size 2025 | AUD billion | 11.50 |
| Market Size 2035 | AUD billion | 31.21 |
| CAGR 2026 to 2035 | Percentage | 10.50 % |
| CAGR by Component: Cooling Systems | Percentage | 13.6 % |
| CAGR by Ownership Model: Sovereign AI Campuses | Percentage | 12.8 % |
| CAGR by End User: AI and GPU Cloud Providers | Percentage | 12.1 % |
| CAGR by Region: South Australia | Percentage | 12.4 % |
| Data Centre Projects in the AEMO Connection Process, August 2026 | Projects | 225 |
| Proposed Connection Capacity in the AEMO Process, August 2026 | Gigawatts | 67 |
| Market Share by Region 2025 | New South Wales | Dominant Share |
Power access, platform commitments and sovereign AI ambitions shape the outlook. Construction leads spending today, while cooling and AI-focused campuses expand fastest as rack densities climb.
Grid, planning and sustainability rules now shape where hyperscale capacity can be built, and 2026 brought the clearest signals yet from federal, state and market authorities.
August 2026 - AEMO Forecasts Data Centre Electricity Use to Multiply
August 2026 - Victoria Publishes Its Data Centre Action Plan
July 2026 - AEMO Reports Data Centre Demand Surging in Two States
March 2026 - Canberra Sets National Expectations for Data Centres
Regulators are linking approval to power, water and sovereignty outcomes. Developers that bring their own renewable supply, closed-loop cooling and flexible demand gain a practical advantage in queues and planning.
Recent developments, presented from the most recent, show capital flowing to new states, larger campuses and AI-specific builds, even as tax and planning questions remain open.
August 2026 - NEXTDC Reports Record Contracting and Plans a Larger Melbourne Campus
August 2026 - Zerra DC Lodges a 1.44 GW Campus Application in Queensland
June 2026 - IREN Announces an 800 MW Campus in South Australia
April 2026 - Microsoft Commits AUD 25 Billion to Australian Cloud and AI Capacity
Capital is moving to larger, AI-specific campuses and to states beyond Sydney and Melbourne. Several projects still await approval, so announced scale and delivered capacity can differ materially.
The Expert Market Research’s report on the Australia Hyperscale Data Center Market offers a detailed analysis of the market based on the following segments.
Market Breakup by Component
Construction and Civil Works lead spending, reflected in the 4,000 construction jobs AirTrunk expects for its Melbourne campus announced in December 2025. Power Infrastructure covers substations, switchgear, backup and batteries, shaped by AEMO's 9 GW connection pipeline reported in July 2026. Cooling Systems grow fastest at an estimated 13.6% CAGR, as the OpenAI and NEXTDC campus specifies closed-loop liquid cooling. IT and Compute Infrastructure covers servers, GPUs and racks installed in hyperscale halls. Others includes security, fire protection, monitoring and commissioning services.
Market Breakup by Ownership Model
Wholesale Colocation Campuses lead, as AirTrunk, NEXTDC and CDC lease large halls to cloud tenants; CDC reported about 140 MW of contract wins in six months to March 2026. Hyperscaler Self-Build includes Amazon's AUD 20 billion plan from June 2025. Build-to-Suit and Powered Shell covers tenant-specified buildings, such as the 162 MW Port Melbourne campus approved by Victoria in February 2026. Sovereign AI Campuses grow fastest at an estimated 12.8% CAGR, led by the Eastern Creek S7 project. Others covers smaller enterprise-anchored builds.
Market Breakup by End User
Cloud Service Providers lead, as Microsoft planned a 140% footprint expansion in April 2026 and Amazon Web Services keeps adding Sydney and Melbourne capacity. AI and GPU Cloud Providers grow fastest at an estimated 12.1% CAGR, with OpenAI named initial offtaker for the S7 campus in December 2025. Government and Defence demand is tied to sovereignty, and CDC linked its Perth campus to AUKUS in August 2025. Enterprises and Financial Services lease through colocation, with Commonwealth Bank among OpenAI's local partners. Others covers research bodies and telecommunications carriers.
Market Breakup by Region
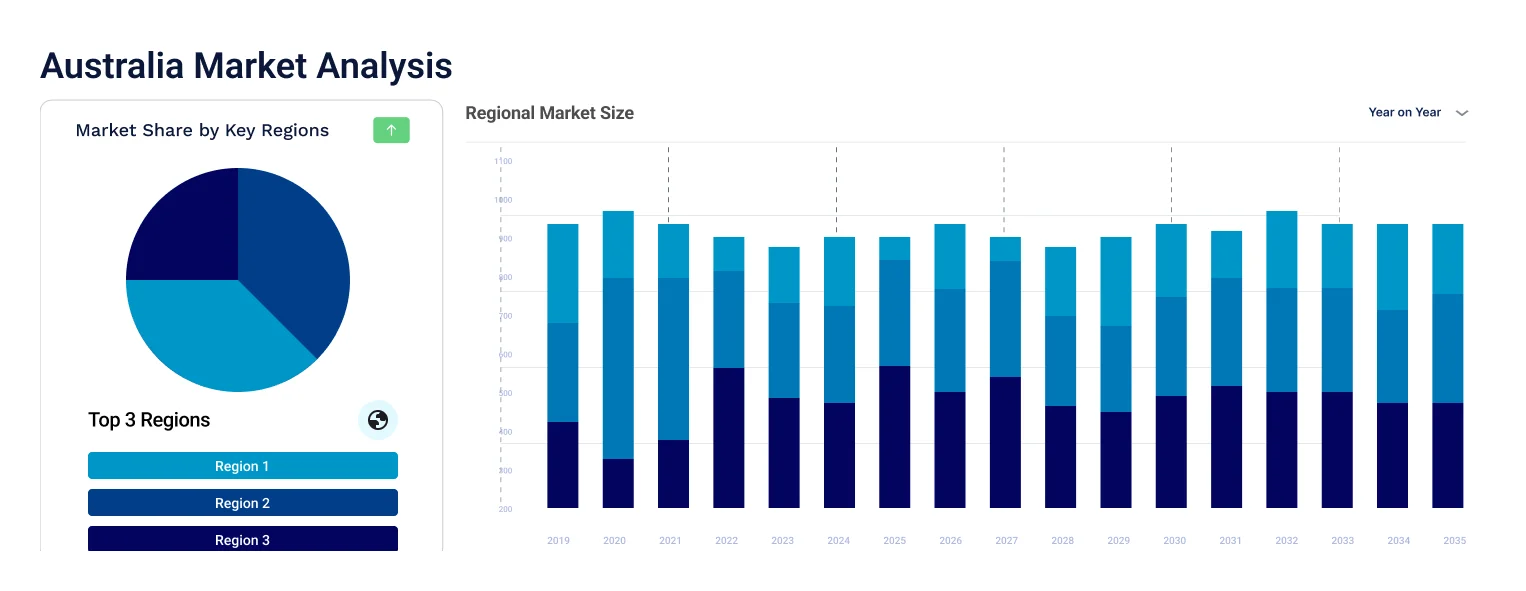
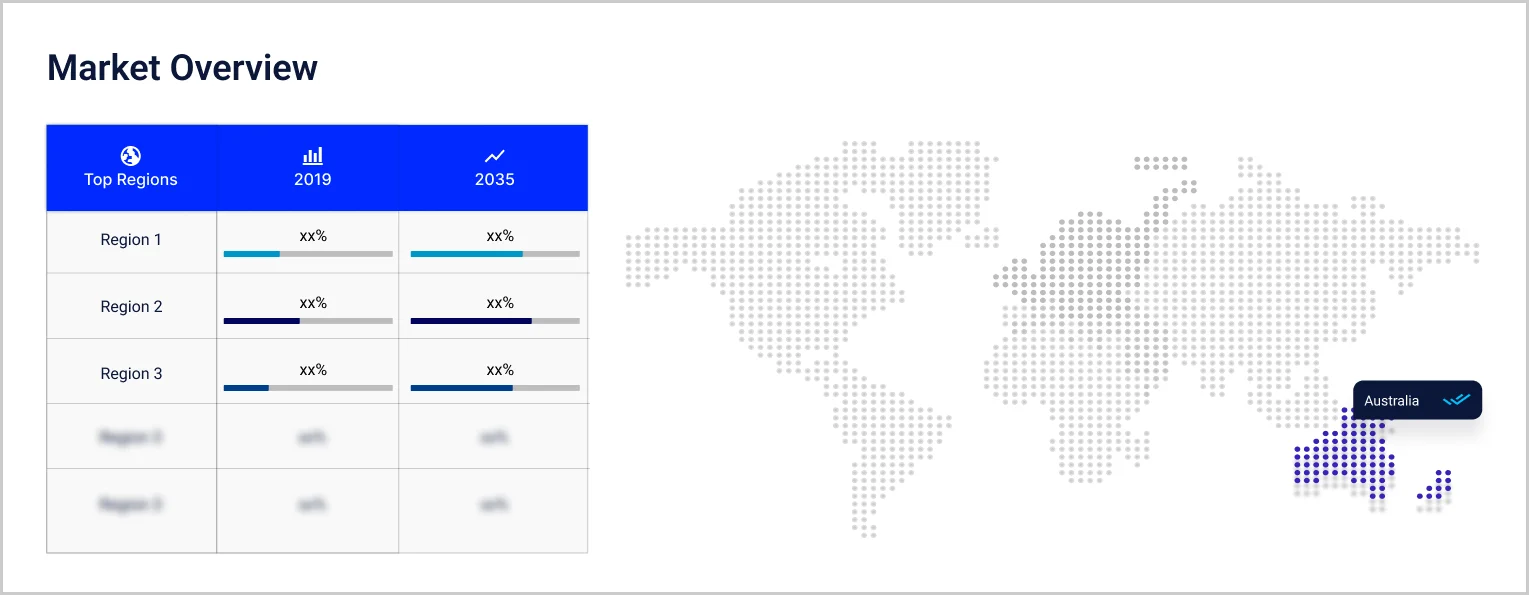
New South Wales dominates, holding 66% of national data centre electricity use in AEMO's August 2026 statement, and grows at an estimated 9.8% CAGR. Victoria follows at 11.2%, helped by AirTrunk's Melbourne expansion and NEXTDC's Port Melbourne approval. Queensland grows at 11.8%, with Zerra's Western Downs application lodged in August 2026. Western Australia rises at 11.4% as CDC builds at Maddington. South Australia is fastest at 12.4%, after IREN's June 2026 announcement. Others covers Tasmania, the ACT and the Northern Territory at 9.6%, including Canberra campuses.
| CAGR 2026 to 2035, Market by Region | Growth Rate |
| New South Wales | 9.8 % |
| Victoria | 11.2 % |
| Queensland | 11.8 % |
| Western Australia | 11.4 % |
| South Australia | 12.4 % |
| Others (incl. Tasmania, the Australian Capital Territory and the Northern Territory) | 9.6 % |
Competition combines hyperscale colocation developers, cloud platforms that build their own capacity and new AI-focused entrants. Barriers include secured grid connections, large pools of patient capital, planning approvals and long-term tenant commitments.
AirTrunk
AirTrunk, headquartered in Sydney, develops and operates hyperscale campuses for cloud and AI tenants and is owned by Blackstone and CPP Investments. In December 2025 it announced a Melbourne campus, MEL2, of more than 354 MW and more than AUD 5 billion, taking Melbourne above 630 MW and its Australian campuses to five with over 1.2 GW. The platform exceeds 2.6 GW across six markets.
NEXTDC
NEXTDC, headquartered in Brisbane, is an ASX-listed operator of carrier-neutral data centres from Sydney to Perth. In August 2026 it reported contracted utilisation of 740.1 MW, a forward order book of 565.1 MW and FY26 net revenue of AUD 405 million. In December 2025 it signed a memorandum of understanding with OpenAI for the 650 MW S7 campus at Eastern Creek in western Sydney.
CDC Data Centres
CDC Data Centres, headquartered in Canberra, builds and owns hyperscale and government campuses in Canberra, Sydney, Melbourne and Auckland, with Infratil holding 49.72%. In January 2026 operating capacity stood at 568 MW within a pipeline of 2,750 MW, and in March 2026 AUD 500 million of equity was provided. In August 2025 it announced a 200 MW Perth campus at Maddington.
Amazon Web Services
Amazon Web Services, part of Amazon, which is headquartered in Seattle, Washington, operates cloud regions in Sydney and Melbourne. In June 2025 it committed AUD 20 billion to expand Australian data center infrastructure from 2025 to 2029. It also agreed to buy over 170 MW from three new solar farms, joining eight existing solar and wind projects that together generate over 1.4 million MWh a year.
Other players operating in the Australia hyperscale data center market include Microsoft, Google, Oracle, Equinix, and Macquarie Technology Group, alongside developers such as Zerra DC and IREN, electricity networks, engineering contractors and cooling and power equipment suppliers serving Australian campuses.
Competition rests on secured power, patient capital, approved sites and anchor tenants rather than price alone. Colocation developers and cloud platforms both expand, while AI-focused entrants add new capacity.


Upto 15% Off
AUD
$2749 $2499
$3849 $3499
$4949 $4499
$6049 $5499


*While we strive to always give you current and accurate information, the numbers depicted on the website are indicative and may differ from the actual numbers in the main report. At Expert Market Research, we aim to bring you the latest insights and trends in the market. Using our analyses and forecasts, stakeholders can understand the market dynamics, navigate challenges, and capitalize on opportunities to make data-driven strategic decisions.*
The Australia hyperscale data center market is valued at AUD 11.50 billion in 2025, supported by cloud platform commitments, AI infrastructure demand and a large grid connection pipeline.
The market is forecast to reach AUD 31.21 billion by 2035, growing at a CAGR of 10.50 % over the 2026 to 2035 period, driven by hyperscale colocation campuses, AI offtake agreements and rising rack densities that require liquid cooling.
Cooling Systems records the highest CAGR at an estimated 13.6% through 2035, as AI racks push operators from air towards liquid cooling that limits potable water use.
New South Wales dominates, holding 66% of national data centre electricity use in AEMO's August 2026 statement. South Australia is the fastest-growing region at an estimated 12.4% CAGR from a small base.
Key players include AirTrunk, NEXTDC, CDC Data Centres, Amazon Web Services, Microsoft, Google, Oracle, Equinix, and Macquarie Technology Group.
Released in March 2026, they ask large data centre developers to show national interest benefits, fund additional renewable energy, cover network costs, use water efficiently and invest in skills. They guide project prioritisation rather than regulate.
It is a very large facility built to scale compute, storage and networking quickly for cloud and AI operators. Campuses in Australia now range from tens of megawatts to planned gigawatt-scale sites.
Explore our key highlights of the report and gain a concise overview of key findings, trends, and actionable insights that will empower your strategic decisions.
| REPORT FEATURES | DETAILS |
| Base Year | 2025 |
| Historical Period | 2019-2025 |
| Forecast Period | 2026-2035 |
| Scope of the Report |
Historical and Forecast Trends, Industry Drivers and Constraints, Historical and Forecast Market Analysis by Segment:
|
| Breakup by Component |
|
| Breakup by Ownership Model |
|
| Breakup by End User |
|
| Breakup by Region |
|
| Market Dynamics |
|
| Competitive Landscape |
|
| Companies Covered |
|
Datasheet
AUD 2,749
AUD 2,499
tax inclusive*
Single User License
AUD 3,849
AUD 3,499
tax inclusive*
Five User License
AUD 4,949
AUD 4,499
tax inclusive*
Corporate License
AUD 6,049
AUD 5,499
tax inclusive*
*Please note that the prices mentioned below are starting prices for each bundle type. Kindly contact our team for further details.*
Flash Bundle
Small Business Bundle
Growth Bundle
Enterprise Bundle
*Please note that the prices mentioned below are starting prices for each bundle type. Kindly contact our team for further details.*
Flash Bundle
Number of Reports: 3
20%
tax inclusive*
Small Business Bundle
Number of Reports: 5
25%
tax inclusive*
Growth Bundle
Number of Reports: 8
30%
tax inclusive*
Enterprise Bundle
Number of Reports: 10
35%
tax inclusive*
How To Order

Select License Type
Choose the right license for your needs and access rights.

Click on ‘Buy Now’
Add the report to your cart with one click and proceed to register.

Select Mode of Payment
Choose a payment option for a secure checkout. You will be redirected accordingly.
Strategic Solutions for Informed Decision-Making
Stay upgraded and grab opportunities by strategic insights
Stay informed and aware for a Market Leverage
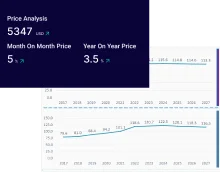
Analyze pricing patterns with comprehensive trend analyses.
Analyse trade data for supply chain insights.
Leverage cost reports for smart savings
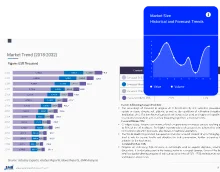
Elevate supply chain with collaboration
Contact Us for Further Information
Our specialized analysts will be available to answer all the pre-purchase and post-purchase queries regarding the report.
Our specialized analysts will be available to answer all the pre-purchase and post-purchase queries regarding the report.
Staying one step ahead of the market landscape with our in-depth research methods, integrating advanced analytics to drive precise and tangible outcomes.
Our expert analyst team offers a significant advantage over competitors, with extensive market insights into the latest trends, putting you strategically ahead.
We deliver a simplified yet extensive report, comprising in-depth industry insights and analytics tailored to your industry requirements.
We are happy to help you navigate through the services we offer and solve your queries.
Contact us