Consumer Insights
Uncover trends and behaviors shaping consumer choices today
Procurement Insights
Optimize your sourcing strategy with key market data
Industry Stats
Stay ahead with the latest trends and market analysis.
The Australia footwear market covers athletic footwear such as sports shoes, trekking and hiking shoes and running shoes, and non-athletic footwear such as flip-flops and slippers, boots and sneakers, sold at mass and premium price points to men, women and kids through stores and online channels. Compared with apparel, footwear is bought for fit, support and function, so shoppers replace it on wear rather than fashion cycles alone.
In 2025, the market is valued at AUD 1720.00 million in 2025 and is forecast to grow at a CAGR of 5.60%, reaching AUD 2965.98 million by 2035. Growth is driven by the Accent Group network of 876 stores at the end of FY26, online footwear spend that rose 8.9% in 2025, and the planned rollout of at least 50 Sports Direct stores in Australia over six years.
Compound Annual Growth Rate
5.6%
Value in AUD million
2026-2035
The Australia footwear market is at an inflection point. Department stores and independent shoe shops once set the pace, but multi-brand sports chains, brand flagships and online ordering now compete for the same spend, while global brands rebuild margins and shoppers weigh price, comfort and brand more carefully.
Three forces are shaping the market: premium running demand, with HOKA opening a Pitt Street flagship in June 2026; omnichannel growth, with online footwear spend up 8.9% in 2025; and retail consolidation, as Frasers Group bids AUD 0.65 per Accent Group share.
In February 2026 Accent Group reported 898 stores at the half year, in June 2026 Frasers Group launched its cash offer, and in August 2026 Accent reported 876 stores and a goodwill impairment of AUD 48.6 million, closing its OzSale and Glue banners.
The market is moving from price-led, store-only shoe buying towards branded running, lifestyle sneakers and online ordering. Non-athletic footwear holds the largest share because flip-flops and slippers, boots and sneakers cover daily wear, and it also grows fastest. Mass pricing leads on volume, while premium grows quicker as shoppers trade up to performance brands. Offline stores lead distribution for fitting and returns, while online grows fastest. New South Wales is the biggest region, and Western Australia grows quickest. Store rollouts, brand flagships and refunded tariffs point to a durable, multi-year demand outlook rather than a cyclical uplift.
| Metric | Value |
| Market Size 2025 | AUD 1720.00 million |
| Projected Market Size 2035 | AUD 2965.98 million |
| CAGR 2026 to 2035 | 5.60% |
| Fastest-Growing Type | Non-athletic Footwear: 6.2% CAGR |
| Fastest-Growing Pricing | Premium: 5.9% CAGR |
| Largest Revenue Segment 2025 | Non-athletic Footwear |
| Dominant Region | New South Wales |
| Highest CAGR by Region | Western Australia: 6.0% |
| Households that bought footwear online (Australia Post, 2025) | 2.8 million |
Store Rollouts and Online Anchor Growth
Revenue is on course to grow by about 73% across the decade, from AUD 1,720.00 million in 2025 to AUD 2,970.00 million in 2035 at a 5.6% CAGR. Accent Group's 876 stores, the planned Sports Direct rollout and online spend growth of 8.9% in 2025 turn everyday footwear demand into a funded retail pipeline that supports durable growth.
Non-athletic and Premium Lead Growth
Non-athletic Footwear grows at an estimated 6.2% CAGR and Premium at an estimated 5.9% CAGR through 2035, ahead of the overall market. Sneakers and boots suit daily wear, while HOKA's Pitt Street flagship, opened in June 2026, shows premium running brands investing in Sydney and adding services such as podiatry and physiotherapy support.
Frasers Bid Reshapes Retail Competition
Frasers Group declared its AUD 0.65 per share offer for Accent Group best and final on 28 October 2026, and the offer now runs to 29 January 2027, so ownership of one of the leading sports footwear retailers may change. Accent's board has criticised the price at length, and its directors stand for re-election on 20 November 2026.
| Report Summary | Unit | Value |
| Base Year | AUD million | 2025 |
| Historical Period | AUD million | 2019 to 2025 |
| Forecast Period | AUD million | 2026 to 2035 |
| Market Size 2025 | AUD million | 1720.00 |
| Market Size 2035 | AUD million | 2965.98 |
| CAGR 2026 to 2035 | Percentage | 5.60 % |
| CAGR by Type: Non-athletic Footwear | Percentage | 6.2 % |
| CAGR by Pricing: Premium | Percentage | 5.9 % |
| CAGR by Distribution Channel: Online | Percentage | 7.4 % |
| CAGR by Region: Western Australia | Percentage | 6.0 % |
| Accent Group Stores at End of FY26 | Number | 876 |
| Growth in Online Footwear Spend in 2025 | Percentage | 8.9 |
| Market Share by Region 2025 | New South Wales | Dominant Share |
Branded running, everyday sneakers and online ordering are reshaping how Australians buy shoes. Non-athletic footwear leads on scale and growth, mass pricing leads on volume, and premium and online grow fastest as shoppers trade up and move to digital channels. New South Wales leads on scale while Western Australia grows quickest. Growth is steady rather than rapid, and it rests on company results, store rollouts and published retail data rather than speculative forecasts, which keeps the outlook durable through the forecast period.
The Australia footwear market is being reshaped by tariff refunds for global brands, a wholesale shift at Nike, strong performance running demand and new midsole technology.
October 2026 - Tariff Refunds Lift Margins at Global Footwear Brands
June 2026 - Nike Rebalances Towards Wholesale Retail Partners
May 2026 - ASICS Posts Strong First Quarter Growth in Running
March 2026 - Superfoam and Carbon Plate Models Reach Specialist Shelves
Tariff refunds, Nike's wholesale shift, ASICS growth and superfoam running shoes show a market where brands are investing again. Retailers with wide ranges and fitting expertise gain most from that investment. Growth is structurally supported through the forecast period, with the policy, demand and technology shifts all pointing the same way for the market.
Recent developments, presented from the most recent, show Frasers Group's final offer for Accent Group, Accent's FY26 result, the HOKA Sydney flagship and the JD Sports Melbourne flagship.
October 2026 - Frasers Group Declares Accent Group Offer Best and Final
August 2026 - Accent Group Reports FY26 Result and Exits Loss Making Banners
June 2026 - HOKA Opens Pitt Street Flagship in Sydney
July 2025 - JD Sports Opens Largest ANZ Flagship on Bourke Street Mall
Frasers Group's final offer, Accent Group's FY26 result, HOKA's Sydney flagship and the JD Sports Melbourne flagship show a shift from expansion planning to delivery and consolidation. Established retailers are closing weak banners while brands invest in premium stores. These events validate steady demand with sharper competition.
The Expert Market Research’s report on the Australia Footwear Market offers a detailed analysis of the market based on the following segments.
Market Breakup by Type
Non-athletic Footwear leads, in our estimate, because flip-flops and slippers, boots and sneakers cover everyday wear, and it also grows fastest at an estimated 6.2% CAGR through 2035. Athletic Footwear, covering sports shoes, trekking and hiking shoes and running shoes, is smaller but gaining through premium running, with HOKA opening a Pitt Street flagship in June 2026. Accent Group opened UGG, Lacoste and Sports Direct stores in FY26, reported in August 2026. Others in both groups cover specialist styles.
Market Breakup by Pricing
Mass leads, in our estimate, because most households buy value and mid-priced ranges across multi-brand chains, and Accent Group reported 876 stores in August 2026. Premium grows fastest at an estimated 5.9% CAGR through 2035, helped by the HOKA flagship opened in June 2026 and the JD Sports Bourke Street Mall flagship opened in July 2025, where Nike, Adidas, New Balance, On and Asics are stocked together. Mass remains the larger pool because everyday replacement is price sensitive.
Market Breakup by End Use
Women leads, in our estimate, because women buy the widest range of styles across work, casual and athletic wear. Men follows, with sports, work and boot demand, while Kids is steadier and tied to school and growth replacement cycles. Adidas reported in October 2026 that Running and Training lifted its direct to consumer footwear sales by 6%, and Accent Group's Stylerunner and Lacoste openings in FY26, reported in August 2026, widened the choice for women.
Market Breakup by Distribution Channel
Offline leads, in our estimate, because fitting, returns and immediate availability matter for shoes, and Accent Group ended FY26 with 876 stores, reported in August 2026. Online grows fastest at an estimated 7.4% CAGR through 2035, with Australia Post reporting online footwear spend up 8.9% in 2025, 2.8 million households buying online and 55% of orders using next day or same day delivery. Accent's half year result in February 2026 also noted new Sports Direct and Lacoste stores.
Market Breakup by Region
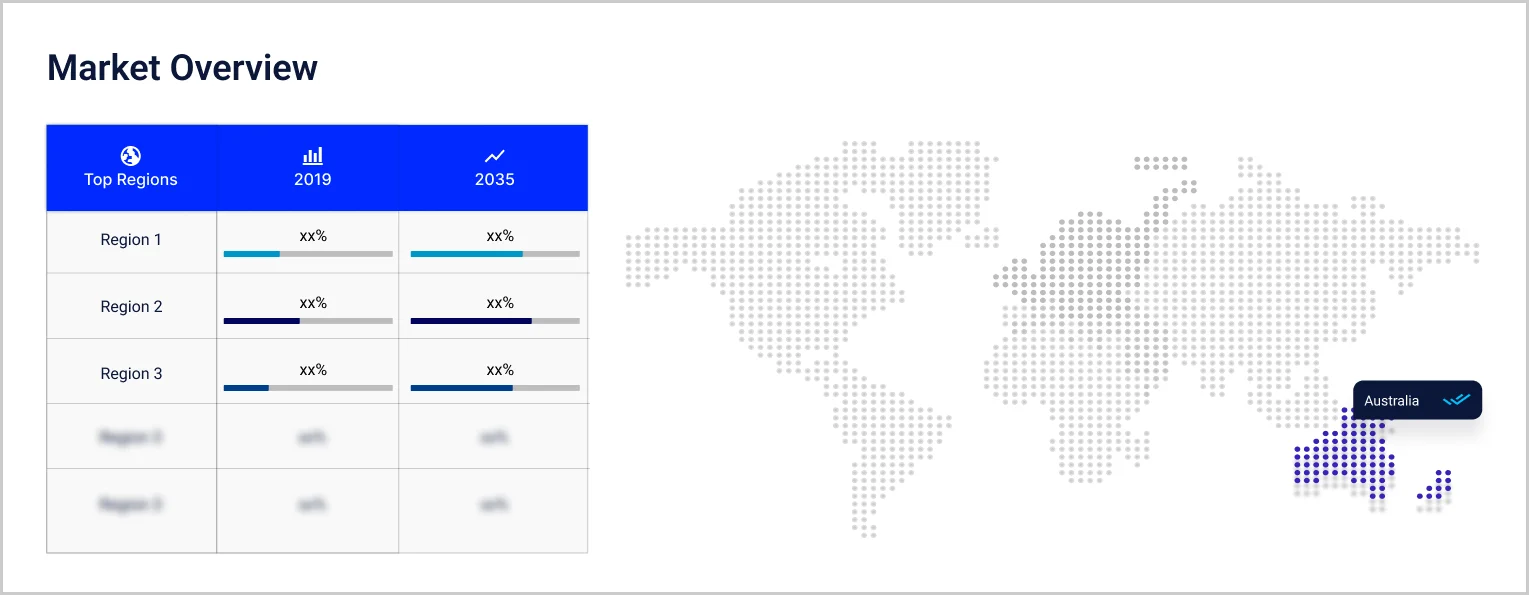
New South Wales dominates, in our estimate, with the largest population and HOKA's Pitt Street flagship from June 2026, and grows at an estimated 4.5% CAGR through 2035. Victoria grows at 5.3%, anchored by the JD Sports Bourke Street Mall flagship from July 2025. Queensland grows at 5.9% with Brisbane 2032 ahead. Western Australia grows fastest at 6.0%. Australia Capital Territory is estimated at 5.8%, and Rest of Australia at 5.9%, covering South Australia, Tasmania and the Northern Territory.
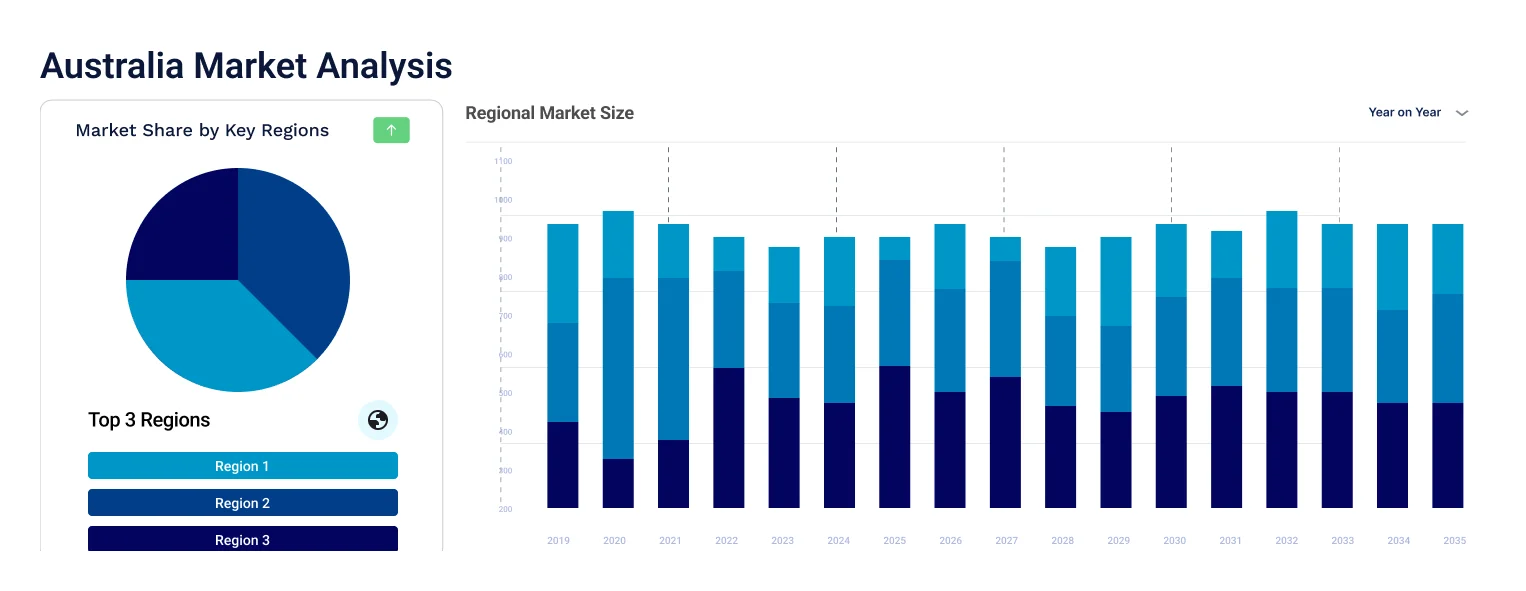
| CAGR 2026 to 2035, Market by Region | Growth Rate |
| New South Wales | 4.5 % |
| Victoria | 5.3 % |
| Queensland | 5.9 % |
| Australia Capital Territory | 5.8 % |
| Western Australia | 6.0 % |
| Others (Rest of Australia) | 5.9 % |
Competition combines global athletic brands, luxury groups, heritage footwear makers and multi-brand retailers that control shelf space and customer relationships. Entry barriers include brand strength, sourcing scale, retailer relationships, product innovation and the cost of flagship and online presence.
Nike Inc.
Nike Inc. is headquartered near Beaverton, Oregon, and was founded in 1964 as Blue Ribbon Sports by Bill Bowerman and Phil Knight, taking the Nike name in 1971. Its portfolio spans Air Max, Air Force 1, Air Jordan and Vaporfly footwear, apparel and the Converse brand. In July 2025 JD Sports opened its largest ANZ flagship in Melbourne with a Nike Home of Air shop-in-shop. Nike reported FY26 revenue of USD 46.4 billion on 30 June 2026, with wholesale up 6%.
Adidas AG
Adidas AG is headquartered in Herzogenaurach, Germany, and was registered in 1949 by Adi Dassler, with roots in the Dassler shoe factory founded in 1924. Its range covers football boots, Adizero running shoes, Samba and Superstar, and apparel. It opened its first Australian flagship, a 1,103 square metre store on Pitt Street, Sydney, in 2023. On 29 October 2026 it reported third quarter revenue of EUR 7.25 billion, up 9%, and lifted its operating profit outlook to about EUR 2.5 billion.
Asics Corp.
Asics Corp. is headquartered in Kobe, Japan, and traces its origins to Kihachiro Onitsuka's 1949 company, with ASICS Corporation formed in 1977. Its portfolio centres on running, with GEL cushioning from 1986 and models such as GEL-Nimbus, alongside the Onitsuka Tiger label. ASICS Tiger Oceania was set up in Sydney in 1986, and a 2013 agreement made ASICS the supplier to the Wallabies. In May 2026 it reported first quarter net sales of JPY 270.2 billion, up 29.7%, showing the strength of its running focus.
Puma SE
Puma SE is headquartered in Herzogenaurach, Germany, and was founded in 1948 by Rudolf Dassler. Its portfolio includes the KING football boot, Clyde basketball shoe, Speedcat and Creeper sneakers, and running and training footwear for sport and street wear. In January 2025 Athletics Australia extended its Puma partnership to 2032, with Puma apparel worn by Australian athletes, coaches and staff at international events. On 30 October 2026 Puma reported third quarter sales of EUR 1,776.2 million, down 5.0%, with Asia Pacific up 10.0% currency adjusted.
Other players operating in the Australia footwear market include LVMH Moët Hennessy Louis Vuitton SE, Kering SA, Under Armour® Inc., Bata Corporation, VF Corporation, and Authentic Brands Group LLC, alongside multi-brand retailers, specialist running brands and local labels supplying footwear across Australia.
Competition rests on brand strength, product innovation and retailer relationships rather than price alone. Nike Inc., Adidas AG, Asics Corp., and Puma SE lead in athletic footwear, while LVMH Moët Hennessy Louis Vuitton SE, Kering SA, Under Armour® Inc., Bata Corporation, VF Corporation and Authentic Brands Group LLC widen luxury, work and lifestyle choice. Frasers Group's October 2026 final offer for Accent Group shows retail control is now contested. Long-term retailer agreements push global brands to build local teams.


Upto 15% Off
AUD
$2749 $2499
$3849 $3499
$4949 $4499
$6049 $5499


*While we strive to always give you current and accurate information, the numbers depicted on the website are indicative and may differ from the actual numbers in the main report. At Expert Market Research, we aim to bring you the latest insights and trends in the market. Using our analyses and forecasts, stakeholders can understand the market dynamics, navigate challenges, and capitalize on opportunities to make data-driven strategic decisions.*
The Australia footwear market is valued at AUD 1720.00 million in 2025, supported by Accent Group's store network, online footwear growth and premium running demand, with New South Wales as the largest region.
The market is forecast to reach AUD 2965.98 million by 2035, growing at a CAGR of 5.60 % over the 2026 to 2035 period, driven by the Sports Direct rollout, online spend growth of 8.9% in 2025 and premium running flagships such as HOKA's Pitt Street store.
Non-athletic Footwear records the highest CAGR at an estimated 6.2% through 2035, as flip-flops and slippers, boots and sneakers suit everyday wear, while Premium leads the pricing tiers at an estimated 5.9%.
New South Wales dominates, as Sydney has the largest population and flagships such as HOKA's Pitt Street store. Western Australia is the fastest-growing region at an estimated 6.0% CAGR, followed by Queensland at 5.9% and Victoria at 5.3%.
Key players include Nike Inc., Adidas AG, Asics Corp., Puma SE, LVMH Moët Hennessy Louis Vuitton SE, Kering SA, Under Armour® Inc., Bata Corporation, VF Corporation, and Authentic Brands Group LLC.
Frasers Group offered AUD 0.65 per Accent share in cash from 15 June 2026, valuing the shares it did not own at about AUD 316 million, and declared the offer best and final on 28 October 2026.
Accent Group reported on 21 August 2026 underlying EBIT of AUD 105.3 million and a statutory loss of AUD 13.8 million after a goodwill impairment of AUD 48.6 million, ending the year with 876 stores.
Explore our key highlights of the report and gain a concise overview of key findings, trends, and actionable insights that will empower your strategic decisions.
| Report Features | Details |
| Base Year | 2025 |
| Historical Period | 2019-2025 |
| Forecast Period | 2026-2035 |
| Scope of the Report |
Historical and Forecast Trends, Industry Drivers and Constraints, Historical and Forecast Market Analysis by Segment:
|
| Breakup by Type |
|
| Breakup by Material |
|
| Breakup by Pricing |
|
| Breakup by Distribution Channel |
|
| Breakup by Region |
|
| Market Dynamics |
|
| Competitive Landscape |
|
| Companies Covered |
|
Datasheet
AUD 2,749
AUD 2,499
tax inclusive*
Single User License
AUD 3,849
AUD 3,499
tax inclusive*
Five User License
AUD 4,949
AUD 4,499
tax inclusive*
Corporate License
AUD 6,049
AUD 5,499
tax inclusive*
*Please note that the prices mentioned below are starting prices for each bundle type. Kindly contact our team for further details.*
Flash Bundle
Small Business Bundle
Growth Bundle
Enterprise Bundle
*Please note that the prices mentioned below are starting prices for each bundle type. Kindly contact our team for further details.*
Flash Bundle
Number of Reports: 3
20%
tax inclusive*
Small Business Bundle
Number of Reports: 5
25%
tax inclusive*
Growth Bundle
Number of Reports: 8
30%
tax inclusive*
Enterprise Bundle
Number of Reports: 10
35%
tax inclusive*
How To Order

Select License Type
Choose the right license for your needs and access rights.

Click on ‘Buy Now’
Add the report to your cart with one click and proceed to register.

Select Mode of Payment
Choose a payment option for a secure checkout. You will be redirected accordingly.
Strategic Solutions for Informed Decision-Making
Stay upgraded and grab opportunities by strategic insights
Stay informed and aware for a Market Leverage
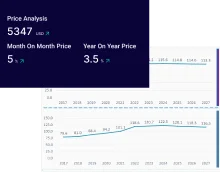
Analyze pricing patterns with comprehensive trend analyses.
Analyse trade data for supply chain insights.
Leverage cost reports for smart savings
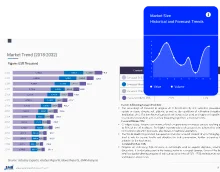
Elevate supply chain with collaboration
Contact Us for Further Information
Our specialized analysts will be available to answer all the pre-purchase and post-purchase queries regarding the report.
Our specialized analysts will be available to answer all the pre-purchase and post-purchase queries regarding the report.
Staying one step ahead of the market landscape with our in-depth research methods, integrating advanced analytics to drive precise and tangible outcomes.
Our expert analyst team offers a significant advantage over competitors, with extensive market insights into the latest trends, putting you strategically ahead.
We deliver a simplified yet extensive report, comprising in-depth industry insights and analytics tailored to your industry requirements.
We are happy to help you navigate through the services we offer and solve your queries.
Contact us