Consumer Insights
Uncover trends and behaviors shaping consumer choices today
Procurement Insights
Optimize your sourcing strategy with key market data
Industry Stats
Stay ahead with the latest trends and market analysis.
The Australia fertilizer market covers the spending on nitrogen, phosphate, potash, sulphur and secondary nutrient products, including urea, ammonium phosphates, ammonium nitrate, liquid nitrogen, bulk blends and enhanced-efficiency formulations, together with the distribution and application services that deliver them to Australian farms. Fertilizers replace the nutrients that crops remove from soil and lift yields on grain, pasture, horticulture and cane land.
In 2025, the market is valued at AUD 6.20 billion and is forecast to grow at a CAGR of 4.30%, reaching AUD 9.45 billion by 2035. Growth is driven by high nutrient replacement needs on cropping land, a reliance on imported nitrogen and phosphate that keeps prices elevated, and new domestic capacity that is meant to rebuild local supply.
Compound Annual Growth Rate
4.3%
Value in AUD billion
2026-2035
The Australia fertilizer market is being reshaped by supply security rather than demand alone. ABARES estimates that agriculture needs about 1.9 million tonnes of nitrogen for November 2025 to October 2026, around 70% of it from 2.9 million tonnes of urea.
Three forces are shaping spending: reliance on imported nitrogen and phosphate, with about 60% of urea supply transiting the Strait of Hormuz; a shift in ownership and government support for domestic plants; and higher input prices, including sulphur, that lift the value of each tonne sold.
In September 2025 Ridley completed its purchase of Incitec Pivot Fertilisers and in October 2025 Fertiglobe completed its Australian distribution acquisition, in April 2026 Australia secured extra Indonesian urea, and in July 2026 governments backed Phosphate Hill with a AUD 160 million loan.
The market is moving from a price-led import trade towards a supply-security model in which governments, distributors and growers hold more inventory and sign earlier contracts. Nitrogen fertilizers still lead because urea underpins grain production, while phosphate fertilizers, enhanced-efficiency products, horticulture and Queensland advance fastest as input costs rise and growers protect nutrient investment. Western Australia remains the largest base, with Queensland growing quickest from a smaller one. Domestic plant support, new Pilbara urea capacity and a more diversified supplier base underpin a durable, multi-year outlook shaped by procurement strategy rather than a short price cycle.
| Metric | Value |
| Market Size 2025 | AUD 6.20 billion |
| Projected Market Size 2035 | AUD 9.45 billion |
| CAGR 2026 to 2035 | 4.30% |
| Fastest-Growing Nutrient Type | Phosphate Fertilizers: 4.9% CAGR |
| Fastest-Growing Product Form | Specialty and Enhanced-Efficiency Fertilizers: 7.6% CAGR |
| Largest Revenue Segment 2025 | Nitrogen Fertilizers |
| Dominant Region | Western Australia |
| Highest CAGR by Region | Queensland: 5.4% |
| Urea supply transiting the Strait of Hormuz | About 60% |
Supply Security Sustains Value Growth
Revenue is set to rise from AUD 6.20 billion in 2025 to AUD 9.45 billion in 2035 at a 4.3% CAGR, as procurement shifts from spot buying to contracted and government-backed supply.
Phosphate and Efficiency Products Lead Growth
Nitrogen fertilizers remain the largest segment, but phosphate fertilizers grow at an estimated 4.9% CAGR and specialty and enhanced-efficiency products at 7.6% through 2035.
Domestic Capacity Reshapes Sourcing
Phosphate Hill support and Perdaman's urea start-up in 2027 shift part of national supply onshore, which changes which distributors and importers win contracts.
| Report Summary | Unit | Value |
| Base Year | AUD billion | 2025 |
| Historical Period | AUD billion | 2019 to 2025 |
| Forecast Period | AUD billion | 2026 to 2035 |
| Market Size 2025 | AUD billion | 6.20 |
| Market Size 2035 | AUD billion | 9.45 |
| CAGR 2026 to 2035 | Percentage | 4.30 % |
| CAGR by Nutrient Type: Phosphate Fertilizers | Percentage | 4.9 % |
| CAGR by Product Form: Specialty and Enhanced-Efficiency Fertilizers | Percentage | 7.6 % |
| CAGR by Crop Type: Horticulture and Vegetables | Percentage | 5.7 % |
| CAGR by Region: Queensland | Percentage | 5.4 % |
| Urea Requirement November 2025 to October 2026 | Million Tonnes | 2.9 |
| Nitrogen Requirement November 2025 to October 2026 | Million Tonnes | 1.9 |
| Market Share by Region 2025 | Western Australia | Dominant Share |
Import reliance for nitrogen and phosphate, firmer input prices and government-backed domestic capacity shape spending. Phosphate and efficiency products advance fastest while nitrogen remains the largest base.
The Australia fertilizer market is being reshaped by phosphate buying caution, domestic plant rescues, an ammonia outage in the west and emergency urea sourcing from alternative suppliers.
September 2026 - Importers Hesitate Over Phosphate Cargoes for 2027
July 2026 - Phosphate Hill Changes Hands With Government Backing
May 2026 - Yara Pilbara Ammonia Outage Tightens Western Supply
April 2026 - Canberra Streamlines Imports and Secures Indonesian Urea
Importers are delaying cargoes, governments are propping up domestic plants and outages in the west have pushed buyers to alternative suppliers, making procurement strategy as important as price.
Recent developments, presented from the most recent, show the Australia fertilizer market moving from ownership changes and new capacity plans into federally backed shipments and rising input costs.
August 2026 - Wesfarmers Reports Fertilizer Costs Lifted by Middle East Conflict
July 2026 - Federally Backed Urea Trades Land Cargoes
March 2026 - Perdaman Sets Commissioning Timetable for Karratha
October 2025 - Fertiglobe Completes Wengfu Australia Distribution Purchase
Recent events show distributors changing hands, producers building inventory to protect customers and new domestic capacity being timetabled, giving growers more sources but exposing them to firmer input costs.
The Expert Market Research’s report on the Australia Fertilizer Market offers a detailed analysis of the market based on the following segments.
Market Breakup by Nutrient Type
Nitrogen Fertilizers lead because ABARES expects 2.9 million tonnes of urea to supply about 70% of the 1.9 million tonnes of nitrogen needed for November 2025 to October 2026, and the world urea price passed AUD 1,000 a tonne by the end of March 2026. Phosphate Fertilizers grow fastest at an estimated 4.9% CAGR, as Phosphate Hill gained a AUD 160 million loan in July 2026 and sulphur costs lifted ammonium phosphate prices. Potash Fertilizers are the smallest staple segment and less exposed to the Gulf, with Canada supplying most imports. Sulphur, Secondary and Micronutrient Fertilizers grow steadily with deficiency correction in the west.
Market Breakup by Product Form
Granular and Prilled Fertilizers lead because Nutrien Ag Solutions said in April 2026 that the eastern Australian market is about 95% granular. Specialty and Enhanced-Efficiency Fertilizers grow fastest at an estimated 7.6% CAGR, as growers seek to protect costly nitrogen and phosphate from losses. Liquid and Fluid Fertilizers matter most in the west, where Nutrien drew on North American liquid nitrogen stocks in April 2026 and Summit's Kwinana UAN pipeline was approved in April 2025. Bulk Blends and Compounds follow regional mixing demand, with Ridley acquiring Geelong North Shore options in September 2025.
Market Breakup by Crop Type
Cereals and Grains lead because most winter grain crops are sown between April and June, and Nutrien said in April 2026 that growers often book more than half their urea after March or April. Horticulture and Vegetables grow fastest at an estimated 5.7% CAGR, as intensive growers pay more per hectare for reliable nutrition and fertigation products. Oilseeds and Pulses expand with canola area, while Pasture and Forage face cost pressure, with dairy outlets reported in March 2026 to expect higher operating costs from supply risks. Sugarcane, Cotton and Others track Queensland and northern New South Wales demand.
Market Breakup by Region
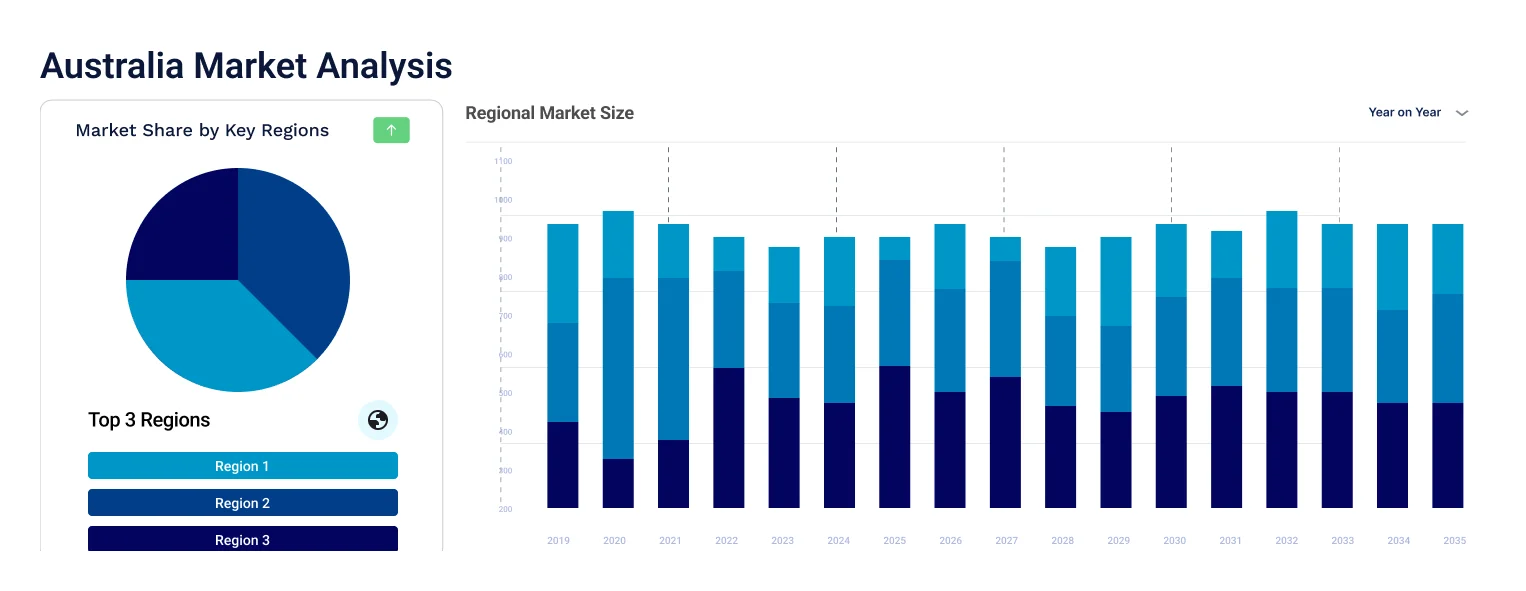
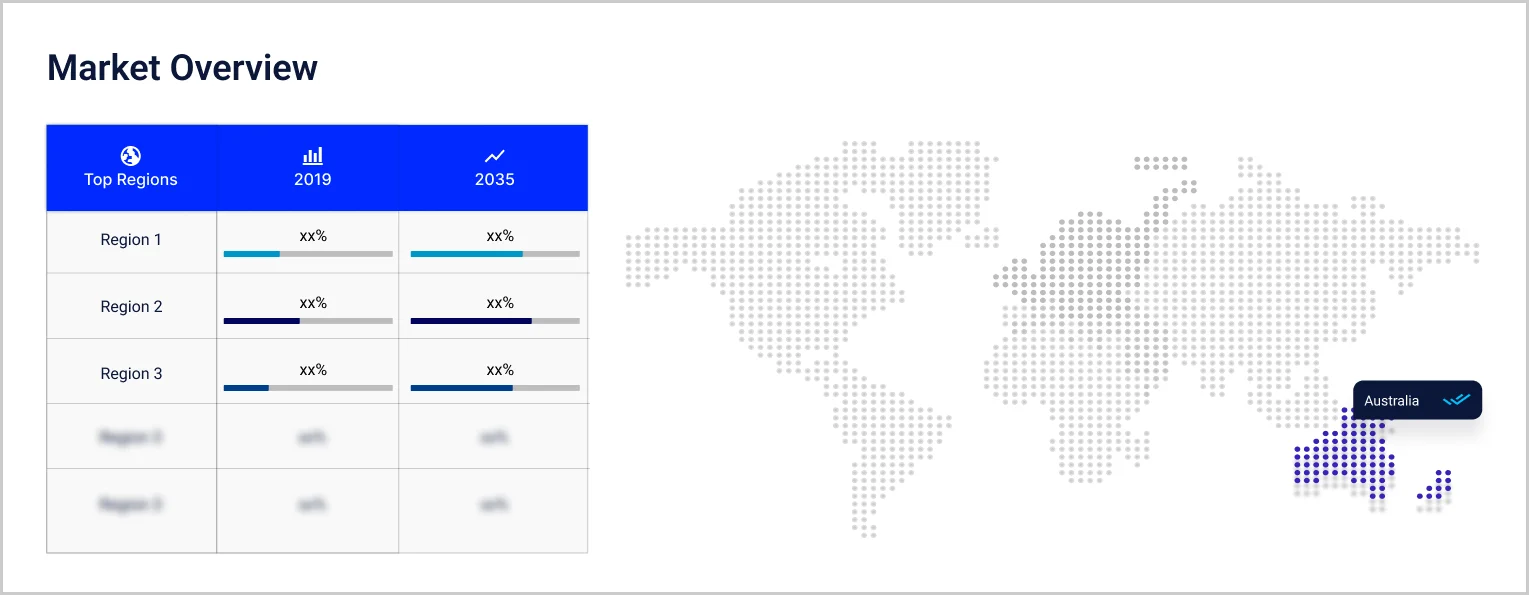
Western Australia dominates, with CSBP lifting ammonia output to 269,000 tonnes in the year to June 2026 and Perdaman targeting commissioning at Karratha in March 2027, and grows at an estimated 4.0% CAGR from that large base. Queensland is fastest at an estimated 5.4%, as the AUD 160 million Phosphate Hill loan was announced in July 2026. New South Wales grows at 4.2%, helped by Orica restarting Kooragang Island ammonia on 1 April 2026, and Victoria at 4.1% around Geelong, where the price indicator peaked on 7 May 2026. Others, grouping South Australia, Tasmania, the ACT and the Northern Territory, grows at 4.5%, with Tasmanian supply reported in April 2026 as holding up.
| CAGR 2026 to 2035, Market by Region | Growth Rate |
| New South Wales | 4.2 % |
| Victoria | 4.1 % |
| Queensland | 5.4 % |
| Western Australia | 4.0 % |
| Others (incl. South Australia, Tasmania, Australian Capital Territory and Northern Territory) | 4.5 % |
Competition combines global nutrient producers, Australian manufacturers, newly consolidated distributors and importers. Entry barriers include secure access to urea and phosphate cargoes, port and storage infrastructure, credit to carry inventory and the logistics to deliver across long rural distances.
Ridley Corporation
Ridley Corporation is headquartered in Melbourne and completed its acquisition of the Incitec Pivot Fertilisers distribution business from Dyno Nobel on 30 September 2025 for AUD 300 million, with options over the Geelong North Shore property. The business agreed 250,000 tonnes of additional Indonesian urea with PT Pupuk Indonesia in April 2026. Trade press reported in March 2026 that Ridley will receive at least 700,000 tonnes a year of Perdaman urea from the offtake holder.
Nutrien Ag Solutions
Nutrien Ag Solutions is the Australian retail arm of Nutrien, headquartered in Saskatoon, Canada, and supplies fertilizer, crop protection and agronomic advice to growers. In April 2026 it said it would honour pre-conflict contracted volumes at agreed prices, drew on North American liquid nitrogen stocks for Western Australia and worked with the federal government through a Fertilizer Supply Working Group.
CSBP
CSBP is the fertilizer and chemicals business of Wesfarmers, which is headquartered in Perth, and operates ammonia and ammonium nitrate plants at Kwinana. In August 2026 Wesfarmers reported that CSBP expanded local manufacturing and built inventory, with ammonia output at 269,000 tonnes and ammonium nitrate at 863,000 tonnes. Trade press reported in May 2025 that it had installed abatement technology at its newest nitric acid ammonium nitrate plant, backed by a WA Government grant of AUD 500,000.
Fertiglobe Australia
Fertiglobe Australia is the local subsidiary of Fertiglobe, headquartered in Abu Dhabi, United Arab Emirates, and distributes urea and other fertilizers through five ports and eight warehouses. It completed the acquisition of Wengfu Australia's distribution assets on 1 October 2025 and previously supplied about 600,000 tonnes of urea a year to Australia. The deal brought more than 200 customers and capacity to reach 1.1 million tonnes a year.
Other players operating in the Australia fertilizer market include Yara Pilbara, Orica, Summit Fertilizers, Perdaman, and Mayfair Australia Corporation, alongside regional distributors, blenders, importers and agronomy retailers supporting growers across Australia.
Competition turns on secure access to imported cargoes, storage and port capacity and the credit to carry inventory rather than price alone, favouring suppliers serving growers through disrupted seasons.


Upto 15% Off
AUD
$2749 $2499
$3849 $3499
$4949 $4499
$6049 $5499


*While we strive to always give you current and accurate information, the numbers depicted on the website are indicative and may differ from the actual numbers in the main report. At Expert Market Research, we aim to bring you the latest insights and trends in the market. Using our analyses and forecasts, stakeholders can understand the market dynamics, navigate challenges, and capitalize on opportunities to make data-driven strategic decisions.*
The Australia fertilizer market is valued at AUD 6.20 billion in 2025, supported by high nutrient replacement needs on cropping land, reliance on imported nitrogen and phosphate, and new domestic capacity, with Western Australia as the largest base.
The market is forecast to reach AUD 9.45 billion by 2035, growing at a CAGR of 4.30 % over the 2026 to 2035 period, driven by phosphate and enhanced-efficiency product demand, government-backed domestic supply and the start-up of new Pilbara urea capacity.
Phosphate Fertilisers record the highest CAGR at an estimated 4.9% through 2035, as sulphur costs lift ammonium phosphate prices and Phosphate Hill gains government-backed investment.
Western Australia dominates, supported by large grain areas and local ammonia and ammonium nitrate production. Queensland is the fastest-growing region at an estimated 5.4% CAGR, helped by the Phosphate Hill loan.
Key players include Ridley Corporation, Nutrien Ag Solutions, CSBP, Fertiglobe Australia, Yara Pilbara, Orica, Summit Fertilizers, Perdaman, and Mayfair Australia Corporation.
About 60% of Australia's urea supply transits the strait, according to an April 2026 government statement. The Persian Gulf also supplies sulphur, so closures raise both nitrogen and phosphate costs.
They are nutrient products designed to release nitrogen or phosphorus more slowly or resist losses to air and water. Growers use them to protect costly nutrients, which explains their 7.6% estimated CAGR.
Explore our key highlights of the report and gain a concise overview of key findings, trends, and actionable insights that will empower your strategic decisions.
| REPORT FEATURES | DETAILS |
| Base Year | 2025 |
| Historical Period | 2019-2025 |
| Forecast Period | 2026-2035 |
| Scope of the Report |
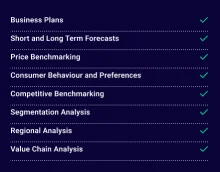
Historical and Forecast Trends, Industry Drivers and Constraints, Historical and Forecast Market Analysis by Segment:
|
| Breakup by Nutrient Type |
|
| Breakup by Product Form |
|
| Breakup by Crop Type |
|
| Breakup by Region |
|
| Market Dynamics |
|
| Competitive Landscape |
|
| Companies Covered |
|
Datasheet
AUD 2,749
AUD 2,499
tax inclusive*
Single User License
AUD 3,849
AUD 3,499
tax inclusive*
Five User License
AUD 4,949
AUD 4,499
tax inclusive*
Corporate License
AUD 6,049
AUD 5,499
tax inclusive*
*Please note that the prices mentioned below are starting prices for each bundle type. Kindly contact our team for further details.*
Flash Bundle
Small Business Bundle
Growth Bundle
Enterprise Bundle
*Please note that the prices mentioned below are starting prices for each bundle type. Kindly contact our team for further details.*
Flash Bundle
Number of Reports: 3
20%
tax inclusive*
Small Business Bundle
Number of Reports: 5
25%
tax inclusive*
Growth Bundle
Number of Reports: 8
30%
tax inclusive*
Enterprise Bundle
Number of Reports: 10
35%
tax inclusive*
How To Order

Select License Type
Choose the right license for your needs and access rights.

Click on ‘Buy Now’
Add the report to your cart with one click and proceed to register.

Select Mode of Payment
Choose a payment option for a secure checkout. You will be redirected accordingly.
Strategic Solutions for Informed Decision-Making
Stay upgraded and grab opportunities by strategic insights
Stay informed and aware for a Market Leverage
Analyze pricing patterns with comprehensive trend analyses.
Analyse trade data for supply chain insights.
Leverage cost reports for smart savings
Elevate supply chain with collaboration
Contact Us for Further Information
Our specialized analysts will be available to answer all the pre-purchase and post-purchase queries regarding the report.
Our specialized analysts will be available to answer all the pre-purchase and post-purchase queries regarding the report.
Staying one step ahead of the market landscape with our in-depth research methods, integrating advanced analytics to drive precise and tangible outcomes.
Our expert analyst team offers a significant advantage over competitors, with extensive market insights into the latest trends, putting you strategically ahead.
We deliver a simplified yet extensive report, comprising in-depth industry insights and analytics tailored to your industry requirements.
We are happy to help you navigate through the services we offer and solve your queries.
Contact us