Consumer Insights
Uncover trends and behaviors shaping consumer choices today
Procurement Insights
Optimize your sourcing strategy with key market data
Industry Stats
Stay ahead with the latest trends and market analysis.
Base Year
Historical Year
Forecast Year


Value in AUD billion
2026-2035
Australia Container Glass Market Outlook
*this image is indicative*
Based on end use, the Australia container glass market share is driven by food as it preserves the freshness, flavour, and quality of food products, extending shelf life and maintaining product integrity
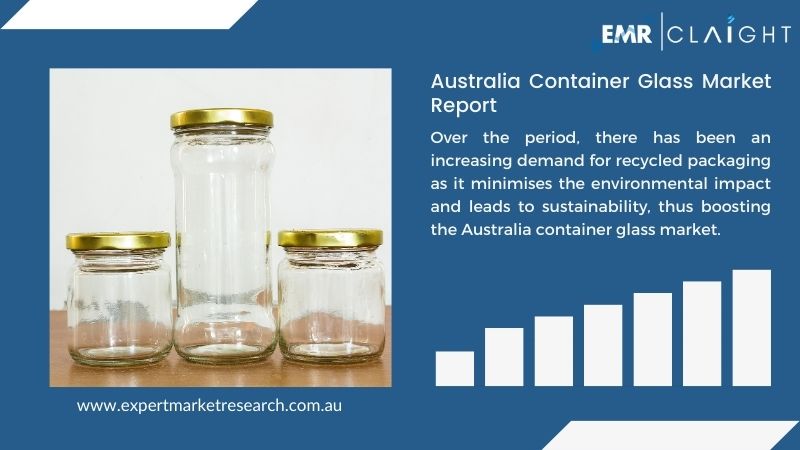
As per Australia container glass market analysis, glass containers can be recycled while minimising the environmental impact and reducing waste in the food industry. Glass packaging is perceived as convenient and hygienic as it offers no risk of leaching contaminants into food products. Over the period, there has been an increasing demand for recycled packaging as it minimises the environmental impact and leads to sustainability, thus boosting the Australia container glass market.
| Australia Container Glass Market Report Summary | Description | Value |
| Base Year | AUD billion | 2025 |
| Historical Period | AUD billion | 2019-2025 |
| Forecast Period | AUD billion | 2026-2035 |
| Market Size 2025 | AUD billion | 1.86 |
| Market Size 2035 | AUD billion | 3.18 |
| CAGR 2019-2025 | Percentage | XX% |
| CAGR 2026-2035 | Percentage | 5.50% |
| CAGR 2026-2035 - Market by Region | Western Australia | 7.1% |
| CAGR 2026-2035 - Market by Region | Australian Capital Territory | 6.6% |
| CAGR 2026-2035 - Market by End Use | Cosmetics | 6.5% |
| CAGR 2026-2035 - Market by Product Type | Bottles | 6.3% |
| Market Share by Region 2025 | Victoria | 26.5% |

The increasing consumption of food and alcoholic and non-alcoholic beverages has been driving the Australia container glass market growth which requires glass packaging to keep the items hygienic and safe from contamination, container glasses are suitable for sensitive or perishable food such as dairy products, sauces and condiments that require stringent hygiene standards. Orora Limited has installed a $25m facility in its new glass beneficiation plant in South Australia to recycle 150,000 tonnes of post-consumer glass each year.
Further, the growing foodservice sector is further pushing the market forward. As per the United States Department of Agriculture, the Australian consumer foodservice sector reached an estimated AUD 54 billion in 2022.
"Australia Container Glass Market Report and Forecast 2026-2035" offers a detailed analysis of the market based on the following segments:
Market Breakup by Product Type
Market Breakup by End Use
Market Breakup by Region
Jars, bottles, and vials are all common types of containers made from glass and are used in various industries including food and beverage, pharmaceuticals, cosmetics, among others. Each type of container serves specific purposes based on the product it holds, such as beverages in bottles, food products in jars, and pharmaceuticals in vials and ampoules. The prominence of each type can vary depending on the market demand and application within each industry.
| CAGR 2026-2035 - Market by | Region |
| Western Australia | 7.1% |
| Australian Capital Territory | 6.6% |
| New South Wales | 4.7% |
| Victoria | XX% |
| Queensland | XX% |
| Others | XX% |
The growth of the container glass market is fuelled by increasing glass packaging recycling, and increasing consumption of food, alcoholic, and non-alcoholic beverages.
*While we strive to always give you current and accurate information, the numbers depicted on the website are indicative and may differ from the actual numbers in the main report. At Expert Market Research, we aim to bring you the latest insights and trends in the market. Using our analyses and forecasts, stakeholders can understand the market dynamics, navigate challenges, and capitalize on opportunities to make data-driven strategic decisions.*
Get in touch with us today for customized, data-driven solutions tailored to your unique requirements!
The Australia container glass market was valued at AUD 1.86 billion in 2025.
The market is projected to grow at a CAGR of 5.50% between 2026 and 2035.
The revenue generated from the market is expected to reach AUD 3.18 billion in 2035.
Based on the product type, the container glass market is bifurcated into jars, bottles, vials and ampoules, and others.
Key players in the industry are Orora Ltd., COSPAK Pty Ltd., Plasdene Glass-Pak Pty Limited, and Visy Industries Australia Pty Ltd. among others.
Based on end use, the container glass market is divided into food, beverage, pharmaceuticals, cosmetics, and others.
The market is broken down into New South Wales, Victoria, Queensland, Australian Capital Territory, Western Australia, and others.
Explore our key highlights of the report and gain a concise overview of key findings, trends, and actionable insights that will empower your strategic decisions.
| Report Features | Details |
| Base Year | 2025 |
| Historical Period | 2019-2025 |
| Forecast Period | 2026-2035 |
| Scope of the Report |
Historical and Forecast Trends, Industry Drivers and Constraints, Historical and Forecast Market Analysis by Segment:
|
| Breakup by Product Type |
|
| Breakup by End Use |
|
| Breakup by Region |
|
| Market Dynamics |
|
| Competitive Landscape |
|
| Companies Covered |
|
Our step-by-step guide will help you select, purchase, and access your reports swiftly, ensuring you get the information that drives your decisions, right when you need it.

Choose the right license for your needs and access rights.

Add the report to your cart with one click and proceed to register.

Choose a payment option for a secure checkout. You will be redirected accordingly.
Pricing Plans


One User
Five Users
Unlimited Users
Our expert team of analysts will offer full support and resolve any queries regarding the report, before and after the purchase.
Our expert team of analysts will offer full support and resolve any queries regarding the report, before and after the purchase.
We employ meticulous research methods, blending advanced analytics and expert insights to deliver accurate, actionable industry intelligence, staying ahead of competitors.
Our skilled analysts offer unparalleled competitive advantage with detailed insights on current and emerging markets, ensuring your strategic edge.
We offer an in-depth yet simplified presentation of industry insights and analysis to meet your specific requirements effectively.
We ensure that you get unmatchable competitive advantage by providing detailed insights about the existing market scenario as well as the emerging and high growth markets.
Regions and Countries with the Highest Number of Returning Clients

Projects delivered with customization
Projects involving industry specific expertise
Analysts Support
Corporates choose us as their preferred partner
Commitment to Excellence
Diverse Teams
Innovative Solutions
Client Centric Approach
Continuous Improvement
United States (Head Office)
30 North Gould Street, Sheridan, WY 82801
+1-415-325-5166
Australia
63 Fiona Drive, Tamworth, NSW
+61 448 06 17 27
India
C130 Sector 2 Noida, Uttar Pradesh 201301
+91-120-433-0800
Philippines
40th Floor, PBCom Tower, 6795 Ayala Avenue Cor V.A Rufino St. Makati City,1226.
+63 287899028, +63 967 048 3306
United Kingdom
6 Gardner Place, Becketts Close, Feltham TW14 0BX, Greater London
+44-753-713-2163
Vietnam
193/26/4 St.no.6, Ward Binh Hung Hoa, Binh Tan District, Ho Chi Minh City
+84865399124