Consumer Insights
Uncover trends and behaviors shaping consumer choices today
Procurement Insights
Optimize your sourcing strategy with key market data
Industry Stats
Stay ahead with the latest trends and market analysis.
The Australia bottled water market covers packaged drinking water sold in bottles, cartons and multipacks, including spring, purified, mineral and sparkling water, through supermarkets, convenience stores, vending machines, cafes and venues. These products are bought for hydration on the move and at home, and are regulated as food under the Australia New Zealand Food Standards Code. Unlike tap water, packaged water is sold on portability, source and brand.
In 2025, the market is valued at AUD 1890.00 million in 2025 and is forecast to grow at a CAGR of 4.10%, reaching AUD 2824.68 million by 2035. Growth is driven by the shift from sugary drinks, with still and sparkling water reaching a 36% market share in 2024, container deposit schemes that now cover more containers from 1 July 2026 in Western Australia, and recycled PET bottles such as Asahi's 100% recycled range from August 2026.
Compound Annual Growth Rate
4.1%
Value in AUD million
2026-2035
The Australia bottled water market is growing as water takes share from sweetened drinks. Spring water brands from Coca-Cola and Asahi sit beside imported and independent labels, while deposit schemes, recycled plastic and rising freight costs are reshaping how bottles are made and priced.
Three forces are shaping the market: demand, as still and sparkling water outsold sugar-sweetened carbonated drinks in 2024; policy, with Western Australia widening its container deposit scheme on 1 July 2026; and costs, as Woolworths lifted its home brand spring water price in October 2026.
In January 2026 the Australian Beverages Council defended bottled water labelling, in August 2026 Asahi moved its water bottles to recycled plastic, and in November 2026 Coca-Cola Europacific Partners recalled Pump spring water nationwide.
The market is moving from convenience purchases towards a staple of everyday hydration. Spring water holds the largest share because major brands such as Mount Franklin and Cool Ridge are built on it, while mineral and sparkling water add premium and flavour options. Off-trade retail sells most volume through supermarkets and convenience stores, and on-trade grows from cafes, venues and tourism. New South Wales remains the largest region, and Western Australia grows quickest. Deposit schemes, recycled packaging and freight costs shape margins, while environmental criticism of single-use bottles remains the main constraint.
| Metric | Value |
| Market Size 2025 | AUD 1890.00 million |
| Projected Market Size 2035 | AUD 2824.68 million |
| CAGR 2026 to 2035 | 4.10% |
| Fastest-Growing Product Type | Mineral Water: 4.8% CAGR |
| Fastest-Growing Distribution Channel | On-Trade: 4.6% CAGR |
| Largest Revenue Segment 2025 | Spring Water |
| Dominant Region | New South Wales |
| Highest CAGR by Region | Western Australia: 4.9% |
| Still and sparkling water market share in beverages (Australian Beverages Council study, 2024) | 36% |
Water Demand and Recycling Anchor Growth
Revenue is on course to rise by about half across the decade, from AUD 1,890.00 million in 2025 to AUD 2,820.00 million in 2035 at a 4.1% CAGR. Water reaching a 36% share of beverages in 2024 and Asahi's recycled bottles from August 2026 support that path.
Spring Water and Off-Trade Lead Sales
Spring Water holds the largest share, while Mineral Water grows at an estimated 4.8% CAGR through 2035. Off-Trade retail leads distribution, and On-Trade grows at an estimated 4.6%, helped by cafes, venues and tourism spending.
Costs and Recalls Test Brand Trust
Pump spring water was recalled nationwide in November 2026, and Woolworths raised home brand water prices in October 2026 on freight and packaging costs, so supply chain control and quality assurance now differentiate leading suppliers.
| Report Summary | Unit | Value |
| Base Year | AUD million | 2025 |
| Historical Period | AUD million | 2019 to 2025 |
| Forecast Period | AUD million | 2026 to 2035 |
| Market Size 2025 | AUD million | 1890.00 |
| Market Size 2035 | AUD million | 2824.68 |
| CAGR 2026 to 2035 | Percentage | 4.10 % |
| CAGR by Product Type: Mineral Water | Percentage | 4.8 % |
| CAGR by Distribution Channel: On-Trade | Percentage | 4.6 % |
| CAGR by Region: Western Australia | Percentage | 4.9 % |
| CAGR by Region: Australia Capital Territory | Percentage | 4.4 % |
| Still and Sparkling Water Market Share (2024) | Percentage | 36 |
| Coles 24 Pack 600 mL Water Price (August 2026) | AUD | 9.50 |
| Market Share by Region 2025 | New South Wales | Dominant Share |
The trajectory reflects a structural move from sweetened drinks to water rather than a short term spike. Spring water carries the volume, mineral water adds premium growth, and off-trade retail supplies most sales while on-trade expands with tourism. New South Wales is the largest region and Western Australia grows quickest. Deposit schemes and recycled plastic add cost but also give brands a sustainability story.
The Australia bottled water market is being reshaped by input cost pressure, recycled plastic, wider container deposit schemes and the steady shift of drinkers from sugary beverages to water.
October 2026 - Freight and Input Costs Lift Shelf Prices of Home Brand Water
August 2026 - Recycled PET Becomes the Standard for Mainstream Water Bottles
July 2026 - Western Australia Widens Container Deposit Scheme Coverage
May 2026 - Water Overtakes Sugary Carbonated Drinks in Share of Beverages
Rising input costs, recycled plastic, wider deposit schemes and the shift to water show demand is structurally supported while costs are becoming harder to avoid. Suppliers that control sourcing and packaging will hold margin, and the category remains central to how Australians hydrate through the forecast period.
Recent developments, presented from the most recent, show a nationwide Pump recall, Coles lifting multipack prices, a Mt Ossa recall and an industry defence of bottled water labelling shaping buyer confidence.
November 2026 - Coca-Cola Europacific Partners Recalls Pump Spring Water Nationwide
August 2026 - Coles Lifts the Price of 24 Pack 600 mL Water to A$9.50
July 2026 - Tasmanian Mountain Waters Recalls Mt Ossa Spring Water Packs
January 2026 - Australian Beverages Council Rejects Claims on Bottled Water Quality
From the council's January 2026 statement to the November 2026 Pump recall, recent events show buyers weighing price, safety and labelling alongside brand. The Mt Ossa recall in July 2026 and Coles pricing in August 2026 confirm that quality control and cost pass-through now sit at the centre of competition.
The Expert Market Research’s report on the Australia Bottled Water Market offers a detailed analysis of the market based on the following segments.
Market Breakup by Product Type
Spring Water leads, in our estimate, because Mount Franklin, Cool Ridge and Frantelle are built on it, and Mt Ossa spring water packs were recalled in July 2026 after distribution through Woolworths. Mineral Water grows fastest at an estimated 4.8% CAGR through 2035, with Beloka drawing from the Snowy Mountains near Dalgety. Purified Water suits refill and office use. Sparkling Water gains as water reached a 36% beverage share, reported in May 2026, and Mount Franklin Lightly Sparkling is sold in cans. Others cover flavoured and functional water.
Market Breakup by Distribution Channel
Off-Trade leads, in our estimate, as supermarkets, convenience stores and vending machines carry most bottled water, and Coles lifted its 24 pack of 600 mL bottles to A$9.50 in August 2026. The Pump recall of November 2026 reached Woolworths, Coles, Aldi, independent grocers, petrol stations and vending machines. On-Trade grows fastest at an estimated 4.6% CAGR through 2035 as cafes, restaurants, venues and tourism operators serve premium still and sparkling water at the table.
Market Breakup by Region
New South Wales dominates, in our estimate, with the largest population and retail base, and grows at an estimated 3.9% CAGR through 2035. Western Australia grows fastest at 4.9%, as Containers for Change widened on 1 July 2026. Victoria grows at 4.0%, with its deposit scheme adding an estimated 5.1 cents to water prices. Queensland grows at 4.3%, helped by Asahi's Wulkuraka water line. The Australia Capital Territory grows at 4.4% from a small base. Rest of Australia grows at 3.7%, covering South Australia, Tasmania and the Northern Territory, where Mt Ossa water is sourced in Tasmania.
| CAGR 2026 to 2035, Market by Region | Growth Rate |
| New South Wales | 3.9 % |
| Victoria | 4.0 % |
| Queensland | 4.3 % |
| Australia Capital Territory | 4.4 % |
| Western Australia | 4.9 % |
| Others (Rest of Australia) | 3.7 % |
Competition combines global beverage groups, Australian bottlers, imported premium labels and independent spring water brands. Entry barriers include source access, bottling scale, retail listings, recycled plastic supply, food safety systems and brand trust.
The Coca-Cola Company
The Coca-Cola Company is headquartered in Atlanta, Georgia, and traces its origins to May 1886, with more than 200 brands across its system. In Australia its water portfolio includes Mount Franklin, a spring water brand launched in 1981 and bottled by Coca-Cola Europacific Partners, together with the Pump range. Coca-Cola Europacific Partners Australia recalled all Pump spring water products on 3 November 2026 over a packaging fault. Its differentiators are brand reach, bottling scale and deep supermarket and vending distribution.
Asahi Holdings (Australia) Pty Ltd.
Asahi Holdings (Australia) Pty Ltd. is part of the global Asahi Group, which was established in 1889, and its Australian beverages arm sells Cool Ridge and Frantelle spring water alongside Schweppes and Pepsi. The company opened an upgraded plant at Wulkuraka, Queensland, in 2022 with a second line planned for spring water. On 19 August 2026 Asahi Beverages confirmed that its water and soft drink bottles use 100% recycled plastic, about 350 million bottles a year. Its differentiators are recycled packaging, local production and broad retail reach.
Fruit Splash
Fruit Splash is an Australian beverage supplier listed in a business directory at Cross Keys Road, Salisbury South, with a flavoured water range that includes Tropical and Wildberry alongside an Aqua Pura water line. Its position in the market rests on flavoured water that sits between plain bottled water and soft drinks, appealing to buyers who want taste without the sugar load of a carbonated drink.
Beloka Water Pty Ltd.
Beloka Water Pty Ltd. is an independent, family-owned bottled water business based in Bella Vista, New South Wales, and founded in 2007 by Joe Commisso. Its water is sourced near Dalgety at the foot of the Snowy Mountains, within Kosciuszko National Park, and is bottled at the source without processing. The brand has been certified Superior by the Fine Waters of the World and is a member of the Australian Beverages Council. Its differentiators are a single mountain source, mineral content and family ownership.
Other players operating in the Australia bottled water market include Neverfail Springwater Proprietary Limited, Fiji Water Company LLC, and West Coast Spring Water Pty Ltd., alongside regional and niche suppliers of spring, mineral and sparkling water across Australia.
Competition rests on source, scale and trust rather than product alone. Coca-Cola and Asahi compete through recycled packaging, bottling capacity and supermarket reach, while Beloka and Fiji Water compete on origin. The Pump recall of November 2026 and Asahi's recycled bottle shift of August 2026 show that quality assurance and sustainability now decide shelf position.


Upto 15% Off
AUD
$2749 $2499
$3849 $3499
$4949 $4499
$6049 $5499


*While we strive to always give you current and accurate information, the numbers depicted on the website are indicative and may differ from the actual numbers in the main report. At Expert Market Research, we aim to bring you the latest insights and trends in the market. Using our analyses and forecasts, stakeholders can understand the market dynamics, navigate challenges, and capitalize on opportunities to make data-driven strategic decisions.*
The Australia bottled water market is valued at AUD 1890.00 million in 2025, supported by the shift from sugary drinks to water, a 36% beverage market share for still and sparkling water in 2024 and wider container deposit schemes, with New South Wales as the largest region.
The market is forecast to reach AUD 2824.68 million by 2035, growing at a CAGR of 4.10 % over the 2026 to 2035 period, driven by demand moving from sweetened drinks to water, recycled plastic bottles and container deposit scheme expansion.
Mineral Water records the highest CAGR at an estimated 4.8% through 2035, supported by premium source water, while On-Trade is the fastest-growing distribution channel at an estimated 4.6%.
New South Wales dominates, as it has the largest population and retail base, and grows at an estimated 3.9% CAGR. Western Australia is the fastest-growing region at an estimated 4.9%, followed by the Australia Capital Territory at 4.4%.
Key players include The Coca-Cola Company, Asahi Holdings (Australia) Pty Ltd., Fruit Splash, Beloka Water Pty Ltd., Neverfail Springwater Proprietary Limited, Fiji Water Company LLC, West Coast Spring Water Pty Ltd.
Coca-Cola Europacific Partners Australia recalled all Pump spring water on 3 November 2026 over a loose sipper choking hazard, and Mt Ossa 10 litre spring water packs were recalled in July 2026 over possible mould.
Coles raised its 24 pack of 600 mL water bottles from A$8 to A$9.50 in August 2026, and Woolworths lifted its 1.5 litre home brand spring water from 80 cents to A$1 in October 2026.
Explore our key highlights of the report and gain a concise overview of key findings, trends, and actionable insights that will empower your strategic decisions.
| Report Features | Details |
| Base Year | 2025 |
| Historical Period | 2019-2025 |
| Forecast Period | 2026-2035 |
| Scope of the Report |
Historical and Forecast Trends, Industry Drivers and Constraints, Historical and Forecast Market Analysis by Segment:
|
| Breakup by Product Type |
|
| Breakup by Distribution Channel |
|
| Breakup by Region |
|
| Market Dynamics |
|
| Competitive Landscape |
|
| Companies Covered |
|
Datasheet
AUD 2,749
AUD 2,499
tax inclusive*
Single User License
AUD 3,849
AUD 3,499
tax inclusive*
Five User License
AUD 4,949
AUD 4,499
tax inclusive*
Corporate License
AUD 6,049
AUD 5,499
tax inclusive*
*Please note that the prices mentioned below are starting prices for each bundle type. Kindly contact our team for further details.*
Flash Bundle
Small Business Bundle
Growth Bundle
Enterprise Bundle
*Please note that the prices mentioned below are starting prices for each bundle type. Kindly contact our team for further details.*
Flash Bundle
Number of Reports: 3
20%
tax inclusive*
Small Business Bundle
Number of Reports: 5
25%
tax inclusive*
Growth Bundle
Number of Reports: 8
30%
tax inclusive*
Enterprise Bundle
Number of Reports: 10
35%
tax inclusive*
How To Order

Select License Type
Choose the right license for your needs and access rights.

Click on ‘Buy Now’
Add the report to your cart with one click and proceed to register.

Select Mode of Payment
Choose a payment option for a secure checkout. You will be redirected accordingly.
Strategic Solutions for Informed Decision-Making
Stay upgraded and grab opportunities by strategic insights
Stay informed and aware for a Market Leverage
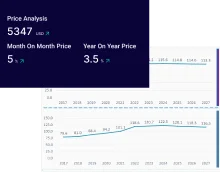
Analyze pricing patterns with comprehensive trend analyses.
Analyse trade data for supply chain insights.
Leverage cost reports for smart savings
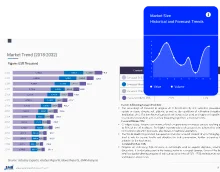
Elevate supply chain with collaboration
Contact Us for Further Information
Our specialized analysts will be available to answer all the pre-purchase and post-purchase queries regarding the report.
Our specialized analysts will be available to answer all the pre-purchase and post-purchase queries regarding the report.
Staying one step ahead of the market landscape with our in-depth research methods, integrating advanced analytics to drive precise and tangible outcomes.
Our expert analyst team offers a significant advantage over competitors, with extensive market insights into the latest trends, putting you strategically ahead.
We deliver a simplified yet extensive report, comprising in-depth industry insights and analytics tailored to your industry requirements.
We are happy to help you navigate through the services we offer and solve your queries.
Contact us