Consumer Insights
Uncover trends and behaviors shaping consumer choices today
Procurement Insights
Optimize your sourcing strategy with key market data
Industry Stats
Stay ahead with the latest trends and market analysis.
The Australia automotive lubricants market covers engine oils, transmission and gear oils, hydraulic fluids, greases, coolants and brake fluids supplied for road vehicles, from passenger cars and motorcycles to light and heavy commercial fleets. These products reduce friction, carry heat away and protect components, so they are consumed through regular servicing and top-ups.
In 2025, the market is valued at AUD 1350.00 million and is forecast to grow at a CAGR of 2.70%, reaching AUD 1762.13 million by 2035. Demand rests on a mature vehicle parc, a long average vehicle age and a base-oil supply chain that relies on imports and a small re-refining sector.
Compound Annual Growth Rate
2.7%
Value in AUD million
2026-2035
The Australia automotive lubricants market is a replacement-driven business that grows through price, mix and fleet size rather than volume. Engine oils remain the largest product family, but transmission, hydraulic, grease and coolant lines widen the revenue base for blenders and distributors.
Three forces shape the outlook: dependence on imported base oil, which Asian price spikes exposed in 2026; slow electrification of the vehicle parc; and a used-oil recovery system that returns a large share of oil to the economy through re-refining.
In October 2025, Viva Energy opened a lubricants and grease plant in Karratha. In December 2025, BP agreed to sell a majority of Castrol, and in June 2026 Asian base oil prices more than doubled, testing supply security.
The market is shifting from a volume story to a value story, as synthetic formulations, longer drain intervals and thermal fluids for newer powertrains lift average selling prices while litres stay broadly flat. Engine oils remain the largest product family, with coolants and brake fluids advancing fastest. Synthetic base oils gain share from mineral grades, and heavy commercial vehicles outgrow passenger cars. Western Australia grows quickest, with New South Wales the largest region. Base-oil security, re-refining and distributor consolidation underpin a steady, low-single-digit outlook.
| Metric | Value |
| Market Size 2025 | AUD 1350.00 million |
| Projected Market Size 2035 | AUD 1762.13 million |
| CAGR 2026 to 2035 | 2.70% |
| Fastest-Growing Product Type | Coolants and Brake Fluids: 3.9% CAGR |
| Fastest-Growing Base Oil Type | Fully Synthetic: 4.4% CAGR |
| Largest Revenue Segment 2025 | Engine Oils |
| Dominant Region | New South Wales |
| Highest CAGR by Region | Western Australia: 3.4% |
| Lubricant sales in 2025 (all uses) | About 656 million litres |
Value Growth Outpaces Volume
Revenue is on course to expand by about 31% across the decade, from AUD 1,350.00 million in 2025 to AUD 1,762.13 million in 2035 at a 2.7% CAGR. Servicing cycles, an ageing parc and premium formulations make demand repeat-driven.
Synthetics and Commercial Fleets Lead
Fully synthetic oils grow at an estimated 4.4% CAGR and heavy commercial vehicles at an estimated 3.6% CAGR through 2035. Coolants and brake fluids advance at 3.9% as newer vehicles need specialised thermal and braking fluids.
Base Oil Security Becomes a Commercial Issue
Supply disruption in 2026 moved base oil from a purchasing detail to a board-level risk. Blenders with local re-refined feedstock and regional plants gain bargaining power.
| Report Summary | Unit | Value |
| Base Year | AUD million | 2025 |
| Historical Period | AUD million | 2019 to 2025 |
| Forecast Period | AUD million | 2026 to 2035 |
| Market Size 2025 | AUD million | 1350.00 |
| Market Size 2035 | AUD million | 1762.13 |
| CAGR 2026 to 2035 | Percentage | 2.70 % |
| CAGR by Product Type: Coolants and Brake Fluids | Percentage | 3.9 % |
| CAGR by Base Oil Type: Fully Synthetic | Percentage | 4.4 % |
| CAGR by Vehicle Type: Heavy Commercial Vehicles | Percentage | 3.6 % |
| CAGR by Region: Western Australia | Percentage | 3.4 % |
| Used Oil Recycled or Re-Refined in Latest Financial Year | Million Litres | 318.5 |
| Re-Refined Base Oil Output Capacity per Year | Million Litres | 80 |
| Market Share by Region 2025 | New South Wales | Dominant Share |
Replacement demand, an ageing vehicle parc and premium formulations support steady value growth, while imported base oil and electrification cap volume. Engine oils lead; thermal and brake fluids gain ground.
The Australia automotive lubricants market is being reshaped by base oil supply stress, a concentrated brand landscape and a vehicle parc that electrifies only slowly.
October 2026 - Lube Report Highlights Australia's Base Oil Exposure
July 2026 - Market Structure Is Concentrated at the Top, Fragmented Below
June 2026 - Middle East Conflict Pushes Base Oil Prices Sharply Higher
July 2025 - Electrification Is Gradual and Combustion Demand Persists
Supply stress and slow electrification pull in opposite directions. Higher input costs squeeze blenders, while an ageing combustion parc keeps servicing demand steady and rewards suppliers with secure feedstock.
Recent developments, presented from the most recent, show the Australia automotive lubricants market moving through brand innovation, ownership change and new regional manufacturing capacity.
May 2026 - Valvoline Restore and Protect Wins an Aftermarket Innovation Award
December 2025 - BP Agrees to Sell a Majority Stake in Castrol
November 2025 - Penrite Extends Supercars Partnership Ahead of Centenary
October 2025 - Viva Energy Opens a Lubricants and Grease Plant in Karratha
Recent events show brand, ownership and capacity decisions being made around supply security. Suppliers are investing close to customers and refreshing products, while a global brand changes hands.
The Expert Market Research’s report on the Australia Automotive Lubricants Market offers a detailed analysis of the market based on the following segments.
Market Breakup by Product Type
Engine Oils lead revenue, with Valvoline's Restore and Protect range winning an aftermarket award in May 2026. Transmission and Gear Oils follow servicing intervals for automatic and manual drivelines, and Penrite lists automatic transmission fluids and differential oils. Hydraulic Fluids serve trucks, tippers and construction fleets. Greases gained local supply when Viva Energy added a grease production unit in Karratha in October 2025. Coolants and Brake Fluids grow fastest at an estimated 3.9% CAGR as newer vehicles need specialised thermal and braking fluids. Others covers power steering fluids and fuel treatments.
Market Breakup by Base Oil Type
Fully Synthetic oils grow fastest at an estimated 4.4% CAGR, as Penrite sources base oils from hydrocracked Group 2 up to Group 4 and 5 stocks. Mineral Oil Based products remain a large value-priced volume pool for older vehicles and fleet top-ups. Semi-Synthetic grades bridge price and performance for the 14-year-old average vehicle. Re-Refined Base Blends draw on about 80 million litres a year of Group I output from Wagga Wagga and Gladstone, reported in October 2026, and gain appeal after Group II prices rose sharply in June 2026.
Market Breakup by Vehicle Type
Passenger Cars lead consumption through the sheer size of the parc and the shift towards synthetic grades, although electric vehicles reached 11% of new car sales in the first quarter of 2025. Light Commercial Vehicles benefit from utility and tradie fleets that service on fixed schedules. Heavy Commercial Vehicles grow fastest at an estimated 3.6% CAGR, supported by mining, freight and agriculture and by Viva Energy's Karratha plant for the Pilbara. Motorcycles and Others covers motorcycles, about 4.5% of the vehicle population, plus buses and specialist road vehicles.
Market Breakup by Region
New South Wales dominates through the largest vehicle parc and Port Botany bulk imports, growing at an estimated 2.5% CAGR through 2035. Victoria follows at 2.4%, with Port Melbourne and Geelong anchoring supply. Queensland grows at 3.0%, helped by coal, agriculture and Ampol's Lytton blending of Mobil lubricants. Western Australia is the fastest-growing region at an estimated 3.4%, driven by iron ore, LNG and the Karratha plant opened in October 2025. South Australia grows at 2.6%. Others covers Tasmania, the ACT and the Northern Territory at 2.9%.
| CAGR 2026 to 2035, Market by Region | Growth Rate |
| New South Wales | 2.5 % |
| Victoria | 2.4 % |
| Queensland | 3.0 % |
| Western Australia | 3.4 % |
| South Australia | 2.6 % |
| Others (incl. Tasmania, the Australian Capital Territory and the Northern Territory) | 2.9 % |
Competition spans fuel majors with local blending, independent Australian brands, global lubricant groups and distributors. Barriers include base oil sourcing, OEM approvals, distribution reach and service-channel relationships.
Viva Energy
Viva Energy, headquartered in Melbourne, is the exclusive Australian licensee and supplier of Shell lubricants and also operates the Geelong refinery. It supplies fuels and lubricants to over 1,500 service stations, as stated in its half-year results of 25 August 2026. In October 2025 it opened an AUD 25 million lubricants and grease plant in Karratha, with 2.4 million litres of storage, to serve Pilbara mining and energy customers.
Ampol
Ampol, headquartered in Sydney, blends and supplies Mobil lubricants at its Lytton manufacturing facility in Queensland under a marketing alliance with ExxonMobil. Mobil 1 and Mobil Super serve passenger and light commercial vehicles, and Mobil Delvac serves trucks. On 24 August 2026 Ampol reported half-year Lytton refiner margin of USD 28.26 a barrel, while its fluid catalytic cracker turnaround continues to October.
Castrol
Castrol, a lubricants business of BP with Australian operations in Melbourne, supplies passenger, commercial and industrial lubricants and is among the brands with local blending. On 29 December 2025 BP announced the sale of 65% of Castrol to Stonepeak at an enterprise value of about USD 10 billion, with completion expected by the end of 2026. The change of ownership is relevant for distribution and supply agreements.
Penrite
Penrite is an Australian-owned lubricant brand with blending plants in Victoria and Queensland, producing more than 170 products across 12 segments, from engine oils and transmission fluids to coolants and brake fluids. Its base oils range from hydrocracked Group 2 to Group 4 and 5. In November 2025 Supercars extended its partnership with Penrite through at least 2027, coinciding with the brand's centenary in 2026.
Other players operating in the Australia automotive lubricants market include Fuchs Lubricants Australasia, Valvoline Global, Southern Oil Refining, Motion Asia Pacific, and International Lubricant Distributors, alongside independent blenders, parts retailers, workshop chains and fuel station operators supplying oils, greases and fluids across Australia.
Competition rests on base oil access, brand approvals, distribution depth and service-channel relationships rather than price. Fuel majors and global groups hold scale, while independents compete through local manufacturing.


Upto 15% Off
AUD
$2749 $2499
$3849 $3499
$4949 $4499
$6049 $5499


*While we strive to always give you current and accurate information, the numbers depicted on the website are indicative and may differ from the actual numbers in the main report. At Expert Market Research, we aim to bring you the latest insights and trends in the market. Using our analyses and forecasts, stakeholders can understand the market dynamics, navigate challenges, and capitalize on opportunities to make data-driven strategic decisions.*
The Australia automotive lubricants market is valued at AUD 1350.00 million in 2025, supported by replacement demand, an ageing vehicle parc and the shift towards synthetic and specialised fluids.
The market is forecast to reach AUD 1762.13 million by 2035, growing at a CAGR of 2.70 % over the 2026 to 2035 period, driven by premium formulations, fleet growth in mining and freight, and gradual electrification that limits volume growth.
Coolants and Brake Fluids records the highest CAGR at an estimated 3.9% through 2035, as newer vehicles need specialised thermal and braking fluids and servicing intervals stay regular.
New South Wales dominates through the largest vehicle parc and import port access. Western Australia is the fastest-growing region at an estimated 3.4% CAGR, helped by mining, LNG and new Pilbara supply capacity.
Key players include Viva Energy, Ampol, Castrol, Penrite, Fuchs Lubricants Australasia, Valvoline Global, Southern Oil Refining, Motion Asia Pacific, and International Lubricant Distributors.
It is an Australian Government scheme that applies a levy to oil-based lubricants and pays benefits to used oil recyclers. Lube Report cited 318.5 million litres recycled or re-refined in the latest financial year.
Australia has no virgin base oil production, and its two crude refineries do not make conventional lubricant base stock. Imports come mainly from Singapore and South Korea, with re-refiners supplying a smaller Group I volume.
Explore our key highlights of the report and gain a concise overview of key findings, trends, and actionable insights that will empower your strategic decisions.
| REPORT FEATURES | DETAILS |
| Base Year | 2025 |
| Historical Period | 2019-2025 |
| Forecast Period | 2026-2035 |
| Scope of the Report |
Historical and Forecast Trends, Industry Drivers and Constraints, Historical and Forecast Market Analysis by Segment:
|
| Breakup by Product Type |
|
| Breakup by Base Oil Type |
|
| Breakup by Vehicle Type |
|
| Breakup by Region |
|
| Market Dynamics |
|
| Competitive Landscape |
|
| Companies Covered |
|
Datasheet
AUD 2,749
AUD 2,499
tax inclusive*
Single User License
AUD 3,849
AUD 3,499
tax inclusive*
Five User License
AUD 4,949
AUD 4,499
tax inclusive*
Corporate License
AUD 6,049
AUD 5,499
tax inclusive*
*Please note that the prices mentioned below are starting prices for each bundle type. Kindly contact our team for further details.*
Flash Bundle
Small Business Bundle
Growth Bundle
Enterprise Bundle
*Please note that the prices mentioned below are starting prices for each bundle type. Kindly contact our team for further details.*
Flash Bundle
Number of Reports: 3
20%
tax inclusive*
Small Business Bundle
Number of Reports: 5
25%
tax inclusive*
Growth Bundle
Number of Reports: 8
30%
tax inclusive*
Enterprise Bundle
Number of Reports: 10
35%
tax inclusive*
How To Order

Select License Type
Choose the right license for your needs and access rights.

Click on ‘Buy Now’
Add the report to your cart with one click and proceed to register.

Select Mode of Payment
Choose a payment option for a secure checkout. You will be redirected accordingly.
Strategic Solutions for Informed Decision-Making
Stay upgraded and grab opportunities by strategic insights
Stay informed and aware for a Market Leverage
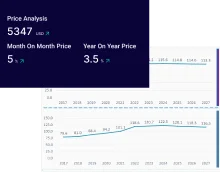
Analyze pricing patterns with comprehensive trend analyses.
Analyse trade data for supply chain insights.
Leverage cost reports for smart savings
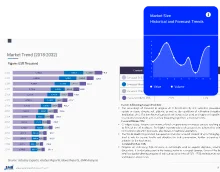
Elevate supply chain with collaboration
Contact Us for Further Information
Our specialized analysts will be available to answer all the pre-purchase and post-purchase queries regarding the report.
Our specialized analysts will be available to answer all the pre-purchase and post-purchase queries regarding the report.
Staying one step ahead of the market landscape with our in-depth research methods, integrating advanced analytics to drive precise and tangible outcomes.
Our expert analyst team offers a significant advantage over competitors, with extensive market insights into the latest trends, putting you strategically ahead.
We deliver a simplified yet extensive report, comprising in-depth industry insights and analytics tailored to your industry requirements.
We are happy to help you navigate through the services we offer and solve your queries.
Contact us