Consumer Insights
Uncover trends and behaviors shaping consumer choices today
Procurement Insights
Optimize your sourcing strategy with key market data
Industry Stats
Stay ahead with the latest trends and market analysis.
The Australia and New Zealand water treatment chemicals market covers coagulants and flocculants, corrosion and scale inhibitors, biocides and disinfectants, and pH adjusters and softeners used to treat municipal drinking water, wastewater, and industrial process and cooling water. Demand is tied to utility capital programmes, tightening drinking water regulation, mining and power water reuse, and drought and PFAS resilience investment across both countries.
In 2025, the market is valued at AUD 1120.40 million and is forecast to grow at a CAGR of 5.40%, reaching AUD 1895.74 million by 2035, as tighter water quality rules, large utility investment, and industrial water reuse lift chemical demand.
Compound Annual Growth Rate
5.4%
Value in AUD million
2026-2035
The Australia and New Zealand water treatment chemicals market is driven by sustained municipal water investment, tightening drinking water and contaminant regulation, and reuse of process and cooling water in mining, power generation, and oil and gas. Utilities and industrial operators treat larger volumes of drinking water, wastewater, and recycled water each year, and every new or upgraded plant lifts demand for coagulants, disinfectants, and corrosion and scale control chemistry.
Three forces are shaping the market: PFAS and drinking water quality regulation, multi-year utility capital programmes in both Australia and New Zealand, and the growth of industrial and mining water reuse in drier states. Domestic manufacturing and distribution, led by Melbourne-based Ixom and Orica, sits alongside imported specialty chemistry from global water treatment suppliers.
In June 2025, the National Health and Medical Research Council updated the Australian Drinking Water Guidelines for PFAS, tightening the values for PFOA to 200 nanograms per litre and PFOS to 8 nanograms per litre. The change pushes utilities toward additional treatment and monitoring and points to sustained procurement of coagulants, biocides, and specialty chemicals through the forecast period.
The Australia and New Zealand water treatment chemicals market expands across the forecast period as tighter water quality rules, large utility investment, and industrial water reuse lift chemical demand. Growth is led by municipal upgrades and tightening PFAS and discharge regulation, supported by rising mining, oil and gas, and power-sector water management across drier regions. Major utility capital programmes in both countries underpin durable procurement of treatment chemicals through the period.
| Metric | Value |
| Market Size 2025 | AUD 1120.40 million |
| Projected Market Size 2035 | AUD 1895.74 million |
| CAGR 2026 to 2035 | 5.40% |
| Fastest-Growing Type | Biocides and Disinfectants: 6.9% CAGR |
| Largest Type | Coagulants and Flocculants |
| Fastest-Growing Region | New Zealand |
| Dominant Region | Australia |
| Key Regulatory Driver | Updated PFAS Drinking Water Guidelines (June 2025) |
| Notable NZ Investment | Watercare NZD 13.8 Billion Plan (March 2025) |
| Leading Local Suppliers | Ixom, Orica |
Regulation and Utility Investment Anchor Steady Growth
The market stands at AUD 1,120.40 million in 2025 and is on track to reach AUD 1,895.74 million by 2035 at a 5.4% CAGR. Growth is anchored by tightening drinking water regulation and multi-year utility capital programmes in both countries, which convert compliance and renewal needs into steady chemical procurement. Suppliers can secure long-term demand by aligning products with PFAS treatment and utility upgrade projects.
Coagulants Lead Volume While Biocides Grow Fastest
Coagulants and flocculants account for the largest share, reflecting their heavy use in municipal drinking water and wastewater clarification, while biocides and disinfectants record the highest growth as utilities and industrial operators tighten disinfection and manage reuse water. Suppliers can capture value by offering high-volume coagulant chemistry alongside specialty biocides for cooling, reuse, and compliance-driven applications, pairing dependable municipal supply with higher-margin specialty products across both countries.
Mining and Industrial Reuse Signal Durable Specialty Demand
Water reuse in mining, power, and oil and gas across Western Australia and Queensland points to a durable pipeline of demand for scale inhibitors, corrosion inhibitors, and biocides. Companies can expand share by developing site-specific programmes and technical service that match the harsh water chemistry of industrial and mining operations in drier regions, while supporting utilities that increasingly recycle water to build long-term resilience against drought and supply constraints.
| Report Summary | Unit | Value |
| Base Year | AUD million | 2025 |
| Historical Period | AUD million | 2019 to 2025 |
| Forecast Period | AUD million | 2026 to 2035 |
| Market Size 2025 | AUD million | 1120.40 |
| Market Size 2035 | AUD million | 1895.74 |
| CAGR 2026 to 2035 | Percentage | 5.40% |
| CAGR by Type: Biocides and Disinfectants | Percentage | 6.9% |
| CAGR by Type: Coagulants and Flocculants | Percentage | 5.2% |
| CAGR by Region: Australia | Percentage | Dominant Share |
| CAGR by Region: New Zealand | Percentage | Steady Growth |
| Key Regulatory Change | Guideline | PFAS ADWG Update (2025) |
| Notable NZ Investment | Programme | Watercare NZD 13.8 Billion (2025) |
| Market Share by Type 2025 | Coagulants and Flocculants | Dominant Share |
The report summary reflects a mature market moving from steady renewal to regulation-driven expansion. A 2025 base of AUD 1,120.40 million scaling to AUD 1,895.74 million by 2035 at a 5.4% CAGR is driven by drinking water regulation, utility investment, and industrial reuse rather than a single programme. Coagulants and flocculants hold the dominant share by volume, while biocides and disinfectants and the New Zealand market records the fastest growth, tying expansion to tighter disinfection rules and utility investment.
The Australia and New Zealand water treatment chemicals market is being shaped by tighter PFAS and drinking water rules, large utility capital programmes, and growing industrial water reuse. The following dated trends, presented from the most recent, show how regulation and investment are driving chemical demand.
March 2026- Veolia Expands PFAS Treatment with Enviropacific Acquisition
July 2025- National PFAS Restrictions Reshape Water Management
June 2025- Tighter PFAS Drinking Water Limits Lift Treatment Demand
March 2025- New Zealand Utility Investment Scales Up Chemical Procurement
These trends point to a market whose growth is structurally supported rather than cyclical. Tighter PFAS rules convert compliance into treatment chemical procurement, large utility programmes in both countries lock in multi-year demand, and desalination and reuse investment reward specialty chemistry. Together they make water treatment chemicals a resilient, regulation-backed category across Australia and New Zealand through the forecast period.
Recent developments, presented from the most recent, show the market advancing on regulation, utility investment, and industrial reuse as water quality and resilience rise up the agenda across both countries.
June 2026- Regulator Approves Melbourne Water Investment Programme
June 2025- Updated PFAS Drinking Water Guidelines Released
March 2025- Watercare Unveils Record Auckland Investment Plan
March 2025- New Zealand Regulator Sets Drinking Water Priorities
The 2024 to 2026 developments show demand being shaped by regulation and utility investment rather than short-lived campaigns. Tighter PFAS guidelines and New Zealand's drinking water rules lift treatment needs, while large capital programmes from Melbourne Water and Watercare widen the installed base of plants. Together they reinforce durable demand for coagulants, disinfectants, and specialty chemistry across Australia and New Zealand.
The EMR report on the Australia and New Zealand water treatment chemicals market offers a detailed analysis based on the following segments, covering type and end use, with a regional breakup across both countries.
Market Breakup by Type
Coagulants and flocculants account for the largest share of the market because they are used in high volumes for clarification in municipal drinking water and wastewater treatment, delivering essential solids removal at relatively low cost, while other chemistries concentrate in industrial and specialty applications.
Market Breakup by End Use
Municipal water and wastewater treatment is the largest end use, reflecting large-scale utility demand for coagulants, disinfectants, and pH adjustment across Australia and New Zealand. Mining and oil and gas record faster growth, supported by industrial water reuse, tailings and process water management, and tighter discharge standards, while power generation and food and beverage sustain steady chemical demand.
Market Breakup by Region
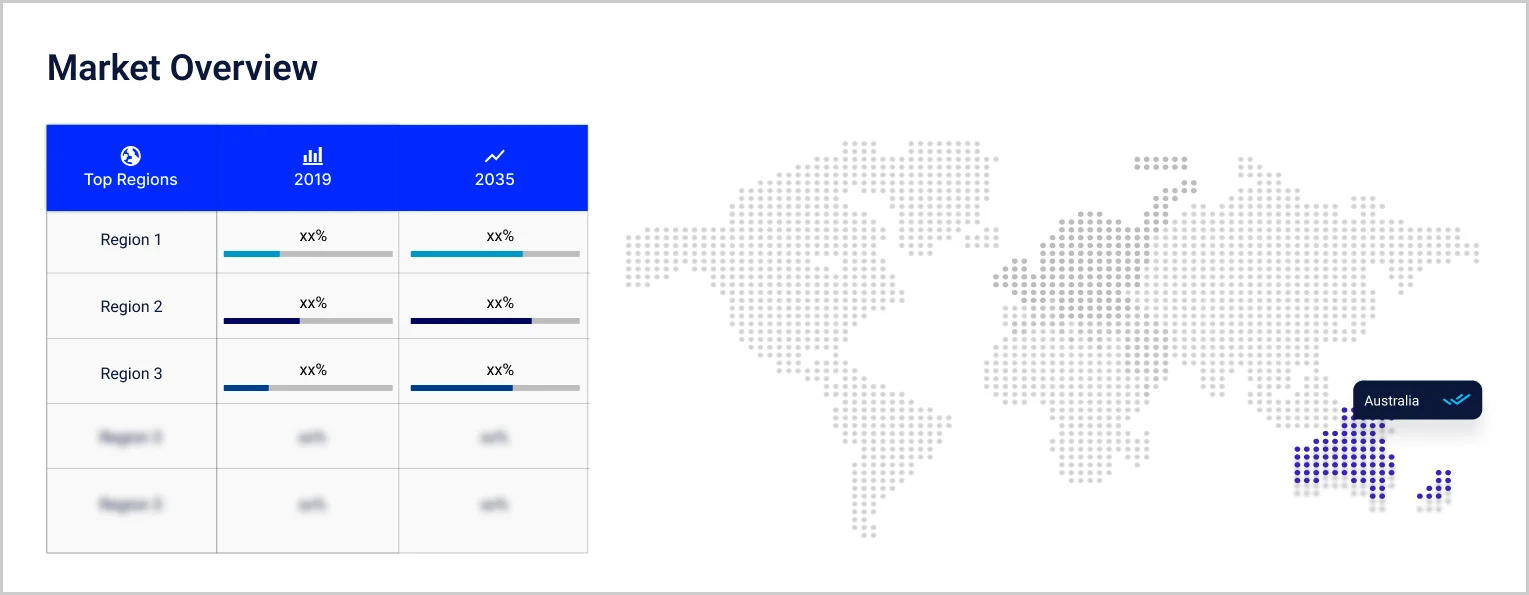
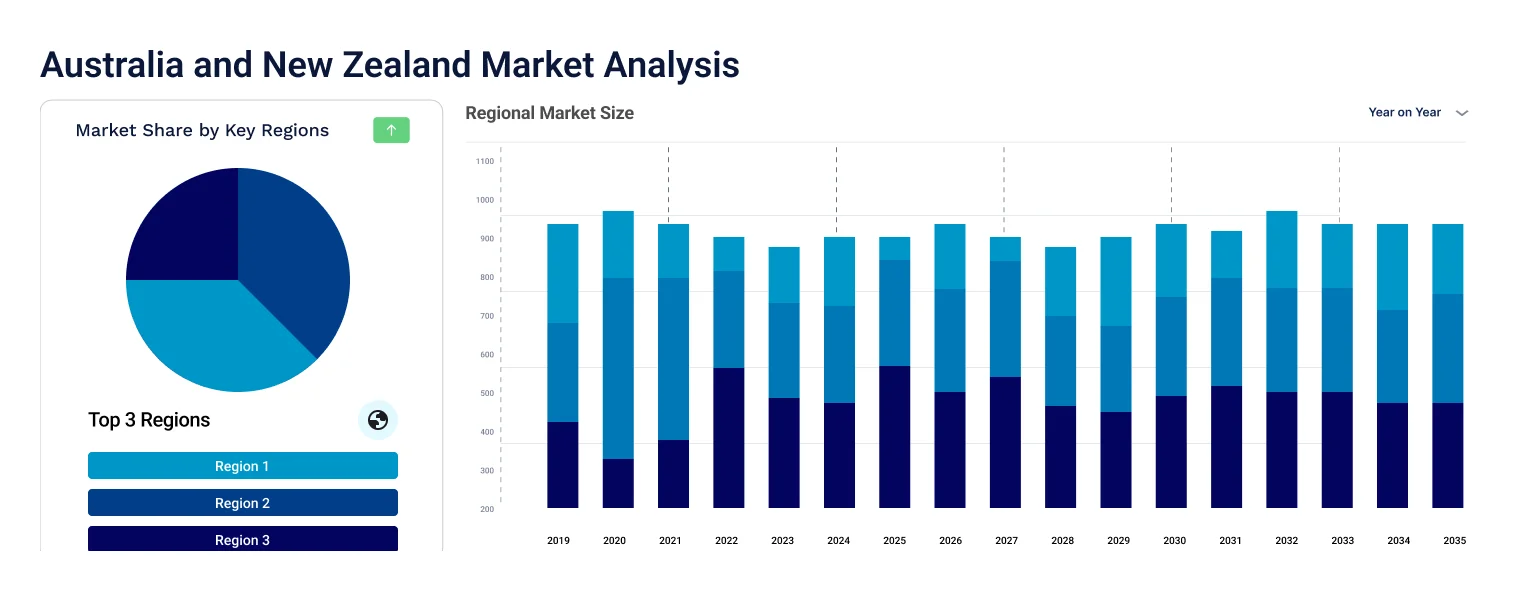
Australia holds the dominant share of the Australia and New Zealand water treatment chemicals market, anchored by its larger population, extensive municipal water networks, and mining and industrial water demand. New Zealand contributes a smaller but faster-growing share, supported by major utility investment and tightening drinking water rules.
| CAGR 2026 to 2035, Market by Region | Growth Rate |
| Australia | Dominant Share |
| New Zealand | Steady Growth |
The market combines global water treatment majors with strong local suppliers and distributors. Chemistry performance, technical service, supply reliability, and regulatory support matter as much as price, and suppliers that pair products with local manufacturing, on-site service, and compliance expertise are best placed.
Ecolab Inc.
Headquartered in Saint Paul, Minnesota, Ecolab is a global water, hygiene, and infection prevention company. Through its Nalco Water business it supplies cooling, boiler, and process water treatment chemicals and services to municipal, power, mining, and food and beverage customers across Australia and New Zealand, pairing chemistry with digital monitoring and on-site technical service.
Kemira Oyj
Kemira is a Helsinki-based chemicals company focused on water-intensive industries. It supplies coagulants, flocculants, and polymers for municipal drinking water and wastewater treatment and for pulp, paper, and industrial applications across Australia and New Zealand, backed by regional supply and technical support that help utilities and industrial clients meet treatment and compliance targets.
Ixom Operations Pty Ltd
Ixom is a Melbourne-headquartered chemicals manufacturer and distributor and the leading supplier of liquefied chlorine and water treatment chemicals across Australia and New Zealand. It manufactures and distributes chlorine, coagulants, and disinfection products to municipal utilities and industrial users, and provides water treatment equipment and services, giving the region a large domestic chemical supplier.
Orica Limited
Orica is a Melbourne-based global mining and infrastructure chemicals company. Through its water treatment and specialty chemicals operations it supplies coagulants, pH adjusters, and treatment products, and provides contaminated water and PFAS management solutions to mining, industrial, and municipal customers across Australia and New Zealand, drawing on deep regional resource-sector relationships.
Other key players in the Australia and New Zealand water treatment chemicals market include BASF SE, Solenis LLC, SNF Group, Kurita Water Industries Ltd., and Veolia Water Technologies.
Competition centres on chemistry performance, technical service, and supply reliability rather than price alone. Ixom and Orica anchor local manufacturing and distribution, global majors such as Ecolab, Kemira, and BASF compete across municipal and industrial chemistry, and specialists such as Solenis, SNF, Kurita, and Veolia add process expertise. Suppliers with local supply, on-site service, and regulatory support are best placed in a market defined by tightening rules and industrial reuse.


Upto 15% Off
AUD
$2749 $2499
$3849 $3499
$4949 $4499
$6049 $5499


*While we strive to always give you current and accurate information, the numbers depicted on the website are indicative and may differ from the actual numbers in the main report. At Expert Market Research, we aim to bring you the latest insights and trends in the market. Using our analyses and forecasts, stakeholders can understand the market dynamics, navigate challenges, and capitalize on opportunities to make data-driven strategic decisions.*
The Australia and New Zealand water treatment chemicals market is valued at AUD 1120.40 million in 2025, reflecting demand for municipal drinking water, wastewater, and industrial process and cooling water treatment across both countries.
The market is forecast to reach AUD 1895.74 million by 2035, growing at a CAGR of 5.40% over the 2026 to 2035 period, driven by tightening water regulation, utility investment, and industrial and mining water reuse.
Biocides and disinfectants record the highest CAGR at an estimated 6.9% through 2035, supported by tighter disinfection rules, industrial and mining reuse water, and cooling water treatment that drive repeat chemical demand.
Australia holds the largest share of the Australia and New Zealand water treatment chemicals market, anchored by its larger population, extensive municipal water networks, and mining and industrial water demand, while New Zealand is a smaller but faster-growing market supported by utility investment and tighter drinking water rules.
Key players include Ecolab Inc., Kemira Oyj, Ixom Operations Pty Ltd, and Orica Limited, alongside BASF SE, Solenis LLC, SNF Group, Kurita Water Industries Ltd., and Veolia Water Technologies.
The June 2025 update to the Australian Drinking Water Guidelines tightened PFAS limits, and IChEMS restrictions from July 2025 further reshaped chemical use, prompting utilities to add treatment and lifting demand for coagulants and specialty chemistry.
New Zealand grows fastest off a smaller base, supported by major utility investment such as Watercare's Auckland programme and tightening drinking water and PFAS rules that lift demand for treatment chemicals.
Explore our key highlights of the report and gain a concise overview of key findings, trends, and actionable insights that will empower your strategic decisions.
| REPORT FEATURES | DETAILS |
| Base Year | 2025 |
| Historical Period | 2019-2025 |
| Forecast Period | 2026-2035 |
| Scope of the Report |
Historical and Forecast Trends, Industry Drivers and Constraints, Historical and Forecast Market Analysis by Segment:
|
| Breakup by Type |
|
| Breakup by End Use |
|
| Breakup by Region |
|
| Market Dynamics |
|
| Competitive Landscape |
|
| Companies Covered |
|
Datasheet
AUD 2,749
AUD 2,499
tax inclusive*
Single User License
AUD 3,849
AUD 3,499
tax inclusive*
Five User License
AUD 4,949
AUD 4,499
tax inclusive*
Corporate License
AUD 6,049
AUD 5,499
tax inclusive*
*Please note that the prices mentioned below are starting prices for each bundle type. Kindly contact our team for further details.*
Flash Bundle
Small Business Bundle
Growth Bundle
Enterprise Bundle
*Please note that the prices mentioned below are starting prices for each bundle type. Kindly contact our team for further details.*
Flash Bundle
Number of Reports: 3
20%
tax inclusive*
Small Business Bundle
Number of Reports: 5
25%
tax inclusive*
Growth Bundle
Number of Reports: 8
30%
tax inclusive*
Enterprise Bundle
Number of Reports: 10
35%
tax inclusive*
How To Order

Select License Type
Choose the right license for your needs and access rights.

Click on ‘Buy Now’
Add the report to your cart with one click and proceed to register.

Select Mode of Payment
Choose a payment option for a secure checkout. You will be redirected accordingly.
Strategic Solutions for Informed Decision-Making
Stay upgraded and grab opportunities by strategic insights
Stay informed and aware for a Market Leverage
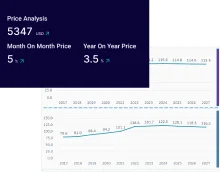
Analyze pricing patterns with comprehensive trend analyses.
Analyse trade data for supply chain insights.
Leverage cost reports for smart savings
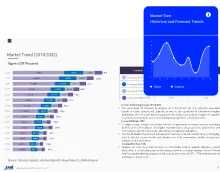
Elevate supply chain with collaboration
Contact Us for Further Information
Our specialized analysts will be available to answer all the pre-purchase and post-purchase queries regarding the report.
Our specialized analysts will be available to answer all the pre-purchase and post-purchase queries regarding the report.
Staying one step ahead of the market landscape with our in-depth research methods, integrating advanced analytics to drive precise and tangible outcomes.
Our expert analyst team offers a significant advantage over competitors, with extensive market insights into the latest trends, putting you strategically ahead.
We deliver a simplified yet extensive report, comprising in-depth industry insights and analytics tailored to your industry requirements.
We are happy to help you navigate through the services we offer and solve your queries.
Contact us