Consumer Insights
Uncover trends and behaviors shaping consumer choices today
Procurement Insights
Optimize your sourcing strategy with key market data
Industry Stats
Stay ahead with the latest trends and market analysis.
Compound Annual Growth Rate
6.5%
Value in AUD billion
2026-2035
|
AUD 36.4 Billion Total Govt Aged Care Expenditure FY2023-24 |
AUD 24 Billion Residential Aged Care Expenditure FY2024-25 |
|
~6.5% CAGR Estimated Expenditure Growth 2026 to 2034 |
224,493 Operational Residential Aged Care Places (June 2025) |
Quick Answer
The Australia aged care market covers residential aged care, home care, home support, and flexible care services delivered to people aged 65 and over, and Aboriginal and Torres Strait Islander people aged 50 and over. The Australian Government funds the overwhelming majority of costs, approximately 76 per cent of residential care and 95 per cent of home care. The aged care market reached ~AUD 44 billion in 2025 and is projected to grow at a CAGR of 6.5 per cent to AUD 82.59 billion by 2035. Growth is anchored by the Aged Care Act 2024 and the Support at Home program, both commenced on 1 November 2025, alongside demographic pressure, with the 85-and-over cohort set to triple to over 3.5 million by FY 2062-2063.
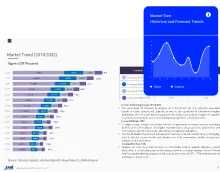
Government spending on the aged care market is large and growing fast. Total expenditure reached AUD 36.4 billion in FY 2023-2024, up 64 per cent from AUD 22.1 billion in FY 2017-2018. Residential care sits at 59 per cent of total expenditure, and home care and support services at 32 per cent. FY 2024-2025 pushed residential aged care spending up a further 12.8 per cent to AUD 24 billion, while Home Care Package funding grew 15 per cent, reflecting real funding pressure from both reform costs and demographic demand.
On the supply side, two constraints loom over the forecast period. The care and support workforce needs to roughly double by 2050; around 549,000 people currently work across the sector, and finding another 500,000-plus while competing with health and disability services is genuinely hard. Capital is the other constraint, the Aged Care Taskforce estimates the residential segment alone needs AUD 56 billion in capital funding to 2050 just to upgrade existing rooms and build the new places the system will need. That mismatch between demographic demand and supply capacity is the defining tension of the australia aged care industry over the next decade.
| Metric | Value |
| Total Govt Aged Care Expenditure FY 2017-2018 | AUD 22.1 Billion |
| Total Govt Aged Care Expenditure FY 2023-2024 | AUD 36.4 Billion |
| Growth FY 2017-2018 to FY 2023-2024 | 64% in total; 36% per person in target population |
| Residential Aged Care Expenditure FY 2024-2025 | AUD 24 Billion (+12.8% YoY) |
| HCP Funding Growth FY 2024-2025 | +15% YoY |
| Govt Share of Residential Care Costs | ~76% |
| Govt Share of Home Care Costs | ~95% |
| Care Recipients' Residential Contributions FY 2023-2024 | AUD 6.1 Billion (25% of residential revenue) |
| Care Recipients' Home Care Contributions FY 2023-2024 | AUD 167 Million (2.9% of home care revenue) |
| Historical CAGR (FY 2017-2018 to FY 2023-2024) | ~8.7% |
| Estimated Total Market (Govt + Co-contrib) FY 2024-2025 | ~AUD 44 Billion |
| Forecast CAGR 2026 to 2035 | ~6.5% |
| Projected 2035 Aged Care Market Value | ~AUD 82.59 Billion |
| Projected Aged Care GDP Share FY 2022-2023 to FY 2062-2063 | 1.1% to 2.5% of GDP |
| Capital Funding Needed (Residential) to 2050 | AUD 56 Billion |
| 2025-2026 Federal Budget Aged Care Investment | AUD 2.9 Billion |
| Support at Home Max Annual Budget (8 levels) | Up to AUD 78,106 per person per year |
The 1 November 2025 Reform Is the Sector's Defining Event
What happened on 1 November 2025 wasn't administrative; the simultaneous commencement of the Aged Care Act 2024 and Support at Home ended a legislative framework that had governed the Australia aged care market since 1997. For providers, it meant new registration categories, a revised funding structure, itemised monthly statements, and stricter, more actively enforced regulatory obligations. Under the new eight-level Support at Home structure, annual budgets per person reach up to AUD 78,106, up from the previous AUD 63,440 cap. That higher ceiling matters for operators planning capacity and care mix.
Demographics and GDP Projections Underpin a Decades-Long Growth Trajectory
Treasury's 2023 Intergenerational Report is the clearest signal of where the Australia aged care market is heading. Government spending is projected to grow from 1.1 per cent of GDP in FY 2022-2023 to around 2.5 per cent by FY 2062-2063, a 127 per cent increase as a share of GDP over forty years. The 85-and-over cohort more than triples to over 3.5 million by then. Historical spending growth averaged 8.7 per cent per annum from FY 2017-2018 to FY 2023-2024 and is expected to ease to a ~6.5 per cent CAGR from 2026 to 2035 as the new contributions model takes effect.
Workforce and Capital Are the Two Critical Supply-Side Constraints
The workforce problem is enormous. Around 549,000 people currently work across the aged care sector, roughly 258,000 in residential. Doubling that figure in 25 years while competing for workers across health and disability is genuinely hard. Capital is the other constraint: the Aged Care Taskforce estimated the residential aged care market needs AUD 56 billion in capital funding to 2050 just to upgrade rooms and build new places. The pipeline of new places isn't growing at a rate that matches 85-and-over population growth.
Key Insight
Residential aged care occupancy recovered to 89.9 per cent at 30 June 2025, the highest since 2018, confirming demand is rising again after the COVID-19 disruption. But the Australia aged care market's 224,493 operational places are demonstrably insufficient for the demographic wave ahead: the 85-and-over cohort will more than triple to over 3.5 million by FY 2062-2063, and the sector needs AUD 56 billion in capital to 2050 simply to upgrade and expand.
Three decades' worth of deferred reform landed on the Australia aged care market in a short window. What's reshaping it right now: the most significant legislative overhaul since 1997, the largest budget commitment the sector has seen, a financial performance uplift giving providers some breathing room, and a home care demand surge the system hasn't kept up with.
Aged Care Act 2024 and Support at Home Commence, 1 November 2025
The Aged Care Act 2024 passed Parliament on 25 November 2024 with bipartisan support and commenced on 1 November 2025, replacing the 1997 Act. Support at Home replaced both Home Care Packages and Short-Term Restorative Care, moving to eight classification levels with annual budgets up to AUD 78,106. Three transition pathways apply depending on approval date.
Clinical care (nursing, physiotherapy and similar) is fully government-funded under Support at Home; independence and everyday living supports attract means-tested participant contributions.
The Commonwealth Home Support Programme has been extended to 30 June 2027 before transitioning to Support at Home, and the Single Assessment System replaced ACAT and RAS in December 2024.
People in the last three months of life can access up to AUD 25,000 in additional Support at Home funding for end-of-life care at home.
2025-2026 Federal Budget Invests AUD 2.9 Billion in Aged Care
The 2025-2026 Federal Budget committed AUD 2.9 billion to the aged care market, building on AUD 2.2 billion in the 2024-2025 Budget for reform implementation and AUD 1.2 billion over five years for digital systems. The biggest line item is wages, which flow straight into provider cost bases.
AUD 2.5 billion over five years for aged care nurse wages, alongside the AUD 2.6 billion Fair Work Commission work value case outcome.
AUD 116.1 million in FY 2025-2026 for the Aged Care Quality and Safety Commission's regulatory functions under the new Act.
AUD 53.2 million in FY 2025-2026 to support the Single Assessment System and digital rollout, and AUD 47.6 million over four years for First Nations aged care assessments.
Residential Aged Care Financial Performance Strengthens in FY 2024-2025
KPMG's Aged Care Sector Analysis 2026, covering the top 25 providers by market share, paints a meaningfully better residential picture than two years ago. Total income rose 28.9 per cent, and revenue per resident per day went up substantially, outpacing the rise in expenses. Total residential expenditure reached AUD 24 billion in FY 2024-2025 (+12.8%), occupancy at 89.9 per cent at 30 June 2025 was the highest since 2018, and permanent admissions hit 66,739 (from 63,639). One problem persists: accommodation services are still running at a loss, and providers need to price them properly to sustain viability alongside care minutes requirements.
Home Care Demand Outpaces Supply Despite Funding Growth
Home care funding in the Australia aged care market grew substantially in FY 2024-2025: HCP funding up 15 per cent, 24,100 additional packages released at AUD 531.1 million. Yet 96,709 people were still waiting at their approved level. That's a structural undersupply issue, not a queue problem. Home care operator numbers grew to 873 by June 2025 (+2.1% YoY), and KPMG anticipates smaller providers will exit as compliance costs rise under the new Act.
Market Breakup by Service Type
Residential Aged Care: The biggest piece of the aged care market, accounting for 59 per cent of total government expenditure in FY 2023-2024. Expenditure reached AUD 24 billion in FY 2024-2025, with 224,493 operational places and 89.9 per cent occupancy at June 2025. Financial performance is improving, but the segment faces a AUD 56 billion capital requirement to 2050.
Home Care (Support at Home, from November 2025): 32 per cent of government expenditure in FY 2023-2024 and growing faster than residential in volume terms. Runs as Support at Home with eight levels and annual budgets up to AUD 78,106. Funding grew 15 per cent in FY 2024-2025, but a 96,709-person wait list shows supply hasn't caught up with demand.
Commonwealth Home Support Programme (CHSP): Entry-level home support for people with lower care needs. Reached over 830,000 clients in FY 2023-2024, the widest-reaching program by volume. Extended to 30 June 2027 before transitioning to Support at Home.
Flexible Aged Care (~3 per cent of expenditure): Covers Transition Care, Multi-Purpose Services, and the National Aboriginal and Torres Strait Islander Flexible Aged Care Program. At June 2025: 3,798 MPS places and 1,829 NATSIFAC places. Critical for rural and remote communities.
Market Breakup by Region
NSW and Victoria account for the biggest shares of aged care expenditure in absolute terms. NSW holds 31 per cent of residential aged care employment, Victoria 24 per cent, and Queensland 21 per cent (2021 Census).
Per-person government expenditure on residential and flexible care was highest in South Australia (AUD 5,100) and lowest in the ACT (AUD 3,900) in FY 2023-2024.
For home care, South Australia again leads at AUD 2,600 per person; the Northern Territory is lowest at AUD 1,700, reflecting genuine access and supply challenges.
Regional and remote areas are a different problem. Multi-Purpose Services combine hospital and aged care in small communities that can't sustain both; the AUD 47.6 million First Nations assessment funding acknowledges a long-standing remote service gap.
The Australia aged care market has a structural feature making it unlike most other large sectors: the Australian Government is simultaneously the primary funder, regulator, and policy setter. Around 98.9 per cent of government funding for aged care came from the federal government in FY 2023-2024. Competitive dynamics are therefore shaped more by an operator's ability to navigate regulatory requirements and manage cost bases under a government-set funding schedule than by conventional market competition. The Aged Care Act 2024 has raised the compliance bar significantly, tending to favour scale.
Ryman Healthcare
A New Zealand-listed operator building Australian presence through integrated retirement villages and aged care facilities, primarily in Victoria. The integrated retirement-plus-care model is increasingly common among well-capitalised operators.
Bupa Aged Care Australia
One of the largest for-profit operators in the Australia aged care market, with residential facilities across all states and territories. Scale advantages in procurement and clinical governance sit alongside heightened regulatory attention.
Calvary Care
A Catholic not-for-profit running residential aged care, home care, and hospital services nationally. Among the larger not-for-profit operators, with community trust positioning that's commercially relevant as quality culture reforms.
HammondCare
A not-for-profit specialising in dementia and complex care, regarded as a clinical leader, particularly in NSW. Dementia specialism is increasingly strategic, as the number of Australians living with dementia is projected to roughly double by 2058.
Regis Healthcare (ASX: REG)
One of the largest listed residential aged care operators, with facilities in Victoria, NSW, Queensland, SA, and WA. A visible beneficiary of the sector's FY 2024-2025 financial recovery as the AN-ACC model matures and occupancy tracks back up.
Other significant players include Estia Health (ASX: EHE), Arcare, Bethanie Group, and Bolton Clarke in residential, and Right at Home, Home Instead, and Benetas in home care. The government's My Aged Care gateway is the single entry point for all aged care services, the most consequential touchpoint in the entire Australia aged care industry, regardless of which provider ultimately delivers the care.
Upto 15% Off
AUD
$2749 $2499
$3849 $3499
$4949 $4499
$6049 $5499


*While we strive to always give you current and accurate information, the numbers depicted on the website are indicative and may differ from the actual numbers in the main report. At Expert Market Research, we aim to bring you the latest insights and trends in the market. Using our analyses and forecasts, stakeholders can understand the market dynamics, navigate challenges, and capitalize on opportunities to make data-driven strategic decisions.*
The Australia aged care market reached ~AUD 44 billion in FY 2024-2025 (government plus co-contributions) and is projected to grow at a ~6.5% CAGR to AUD 82.59 billion by 2035.
The Aged Care Act 2024 was passed by Parliament on 25 November 2024 and commenced on 1 November 2025, replacing the 1997 Act. It legislates a Statement of Rights, Code of Conduct, and enforceable Quality Standards for the Australia aged care market, acting on the Royal Commission's central recommendation.
Support at Home commenced on 1 November 2025, replacing Home Care Packages and Short-Term Restorative Care with eight classification levels and annual government budgets up to AUD 78,106 per person (up from the previous AUD 63,440 cap).
Significantly better. KPMG's Aged Care Sector Analysis 2026 found total income up 28.9 per cent for the top 25 providers in FY 2024-2025. Residential aged care market expenditure reached AUD 24 billion (+12.8%), with occupancy at 89.9 per cent, the highest since 2018.
Treasury's 2023 Intergenerational Report projects aged care spending to grow from 1.1 per cent to about 2.5 per cent of GDP by FY 2062-2063. The 85-and-over cohort more than triples to over 3.5 million, the workforce needs to double by 2050, and capital requirements total AUD 56 billion to 2050.
As of 30 June 2025, the Australia aged care market had 873 home care providers (+2.1% YoY) and 636 residential aged care providers (-0.9% YoY), with the federal government supplying 98.9% of all funding.
Explore our key highlights of the report and gain a concise overview of key findings, trends, and actionable insights that will empower your strategic decisions.
| REPORT FEATURES | DETAILS |
| Base Year | 2025 |
| Historical Period | 2019-2025 |
| Forecast Period | 2026-2035 |
| Scope of the Report |
Historical and Forecast Trends, Industry Drivers and Constraints, Historical and Forecast Market Analysis by Segment:
|
| Breakup by Service Type |
|
| Breakup by Age Group |
|
| Breakup by Ownership |
|
| Breakup by Care Recipient Condition |
|
| Breakup by Region |
|
| Market Dynamics |
|
| Competitive Landscape |
|
| Companies Covered |
|
Datasheet
AUD 2,749
AUD 2,499
tax inclusive*
Single User License
AUD 3,849
AUD 3,499
tax inclusive*
Five User License
AUD 4,949
AUD 4,499
tax inclusive*
Corporate License
AUD 6,049
AUD 5,499
tax inclusive*
*Please note that the prices mentioned below are starting prices for each bundle type. Kindly contact our team for further details.*
Flash Bundle
Small Business Bundle
Growth Bundle
Enterprise Bundle
*Please note that the prices mentioned below are starting prices for each bundle type. Kindly contact our team for further details.*
Flash Bundle
Number of Reports: 3
20%
tax inclusive*
Small Business Bundle
Number of Reports: 5
25%
tax inclusive*
Growth Bundle
Number of Reports: 8
30%
tax inclusive*
Enterprise Bundle
Number of Reports: 10
35%
tax inclusive*
How To Order

Select License Type
Choose the right license for your needs and access rights.

Click on ‘Buy Now’
Add the report to your cart with one click and proceed to register.

Select Mode of Payment
Choose a payment option for a secure checkout. You will be redirected accordingly.
Strategic Solutions for Informed Decision-Making
Stay upgraded and grab opportunities by strategic insights
Stay informed and aware for a Market Leverage

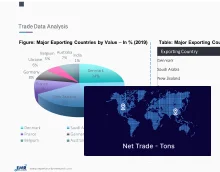
Analyze pricing patterns with comprehensive trend analyses.
Analyse trade data for supply chain insights.
Leverage cost reports for smart savings
Elevate supply chain with collaboration
Contact Us for Further Information
Our specialized analysts will be available to answer all the pre-purchase and post-purchase queries regarding the report.
Our specialized analysts will be available to answer all the pre-purchase and post-purchase queries regarding the report.
Staying one step ahead of the market landscape with our in-depth research methods, integrating advanced analytics to drive precise and tangible outcomes.
Our expert analyst team offers a significant advantage over competitors, with extensive market insights into the latest trends, putting you strategically ahead.
We deliver a simplified yet extensive report, comprising in-depth industry insights and analytics tailored to your industry requirements.
We are happy to help you navigate through the services we offer and solve your queries.
Contact us