Consumer Insights
Uncover trends and behaviors shaping consumer choices today
Procurement Insights
Optimize your sourcing strategy with key market data
Industry Stats
Stay ahead with the latest trends and market analysis.
The Australia toy market covers dolls, plush, action figures, games and puzzles, building sets, sports and outdoor toys and infant and preschool products sold to families, gift buyers and collectors. Compared with general children's goods, toys are designed for play, learning and collecting, and they sell through licensed ranges, seasonal gifting and a growing adult buyer group.
In 2025, the market is valued at AUD 1.80 billion in 2025 and is forecast to grow at a CAGR of 2.80%, reaching AUD 2.37 billion by 2035. Growth is driven by licensed and collectible demand, with licensed toys at 40% of spend in the first half of 2026, building set and trading card sales, and online retail.
Compound Annual Growth Rate
2.8%
Value in AUD billion
2026-2035
The Australia toy market is at an inflection point. Dolls, plush and outdoor toys once defined the category, but trading cards, building sets and licensed collectibles now drive growth, while online stores take a larger share of purchases and adults join children as buyers.
Three forces are shaping the market: licensing, with licensed toys at 40% of spend in the first half of 2026; collectibles, as strategic trading card games supplied more than half of Games and Puzzles growth; and safety regulation, with the ACCC reviewing the lead standard in December 2025.
In July 2025 Hasbro named Jasnor master toy distributor for Peppa Pig. In March 2026 the Australian Toy Fair sold out for the first time since the pandemic, and in August 2026 LEGO reported record first half revenue of DKK 41.9 billion.
The market is moving from traditional play towards collectible, licensed and construction led play, with trading cards and building sets driving recent sales. Games and Puzzles lead on momentum, while the mid-childhood age group is the largest and Online Stores grow quickest among channels. New South Wales is the largest region and the Australian Capital Territory grows quickest. Licences, premium building sets and trade events point to durable growth, although cyclical household spending, collectible volatility and safety compliance remain constraints.
| Metric | Value |
| Market Size 2025 | AUD 1.80 billion |
| Projected Market Size 2035 | AUD 2.37 billion |
| CAGR 2026 to 2035 | 2.80% |
| Fastest-Growing Age Group | Between 5 to 10 Years: 3.1% CAGR |
| Fastest-Growing Distribution Channel | Online Stores: 5.2% CAGR |
| Largest Revenue Segment 2025 | Between 5 to 10 Years |
| Dominant Region | New South Wales |
| Highest CAGR by Region | Australia Capital Territory: 3.2% |
| Growth in toy sales value, first half 2026 (retail tracking data) | 13% |
Licensing and Collectibles Anchor Steady Demand
The market is on course to grow by almost a third across the decade, from AUD 1,800.00 million in 2025 to AUD 2,370.00 million in 2035 at a 2.8% CAGR. Licensed toys rose 16% in the first half of 2026 and made up 40% of toy spend, giving suppliers a licence led demand base even as growth normalises after the recent surge.
Online and Mid-Childhood Segments Lead Growth
Online Stores grow at an estimated 5.2% CAGR and Between 5 to 10 Years at an estimated 3.1% CAGR through 2035, ahead of the overall market. Games and Puzzles rose 49% in dollar terms in the year to October 2025, led by strategic trading card games.
LEGO Record Result Signals Building Set Strength
LEGO reported record first half 2026 revenue of DKK 41.9 billion, up 21%, and named Asia Pacific among regions with strong momentum. In Australia, standard building sets and trading cards made up more than half of premium toy sales.
| Report Summary | Unit | Value |
| Base Year | AUD billion | 2025 |
| Historical Period | AUD billion | 2019 to 2025 |
| Forecast Period | AUD billion | 2026 to 2035 |
| Market Size 2025 | AUD billion | 1.80 |
| Market Size 2035 | AUD billion | 2.37 |
| CAGR 2026 to 2035 | Percentage | 2.80 % |
| CAGR by Age Group: Between 5 to 10 Years | Percentage | 3.1 % |
| CAGR by Distribution Channel: Online Stores | Percentage | 5.2 % |
| CAGR by Region: Australia Capital Territory | Percentage | 3.2 % |
| CAGR by Region: Western Australia | Percentage | 3.0 % |
| Growth in Toy Sales Value, First Half 2026 | Percentage | 13 |
| Licensed Toys Share of Toy Spend, First Half 2026 | Percentage | 40 |
| Market Share by Region 2025 | New South Wales | Dominant Share |
Trading cards, licensed properties and building sets are reshaping what Australians buy in toys. Online Stores and mid-childhood buyers grow fastest, while New South Wales leads on scale and the Australian Capital Territory grows quickest. Growth rests on reported sales data and launches rather than speculative forecasts.
The Australia toy market is being reshaped by strong sales growth, collectible card demand, a review of the lead safety standard and new distribution arrangements for preschool brands.
August 2026 - Toy Sales Value Rises 13% in the First Half of 2026
December 2025 - ACCC Reviews Mandatory Safety Standard for Toys Containing Lead
October 2025 - Games and Puzzles Drive Toy Growth in the Year to October
July 2025 - Hasbro Names Jasnor Peppa Pig Master Toy Distributor
Strong sales growth, a lead standard review, category shifts towards games and a new preschool distributor show a market driven by collectibles and licensing. Regulation and distribution partnerships remain the main enablers. Toys stay a seasonal and licence led purchase through the forecast period.
Recent developments, presented from the most recent, show a record LEGO result, a renewed Bluey toy licence, a sell out trade fair and an independent toy store returning to a regional town.
August 2026 - LEGO Group Reports Record First Half 2026 Revenue
May 2026 - Moose Toys Renews Bluey Master Toy Licence With BBC Studios
March 2026 - Australian Toy Association Holds Sell Out Toy Fair in Melbourne
June 2025 - Toyworld Plans Return to Mildura After Nearly Ten Years
LEGO's record result, the Bluey licence renewal, the sell out Toy Fair and Toyworld's regional return show strength across manufacturers, licensors and retailers. The LEGO results and the Toy Fair are the flagship events. Momentum favours licensed, collectible and construction products sold through both online and specialist channels.
The Expert Market Research’s report on the Australia Toy Market offers a detailed analysis of the market based on the following segments.
Market Breakup by Type
Games and Puzzles lead on momentum, in our estimate, because strategic trading card games supplied more than half of the category's growth in the first half of 2026, and Flip 7 won the Game award in March 2026. Infant and Preschool Toy benefits from Jasnor's July 2025 Peppa Pig appointment. Action Figures include Moose Toys' MrBeast Lab, an Action winner in March 2026. Dolls and Plush saw Monster High and Scruffaluvs win in March 2026, while Hape's Outdoor Easel won the Outdoor award for Sports and Outdoor Toys. Others include bicycles and accessories.
Market Breakup by Age Group
Between 5 to 10 Years leads, in our estimate, and grows fastest at an estimated 3.1% CAGR through 2035, as school age children drive building sets, games and trading cards, with Games and Puzzles up 49% in the year to October 2025. Up to 5 Years is supported by Hasbro's July 2025 Peppa Pig distribution deal and VTech's Peek and Play Learning House, a Judges Choice winner in March 2026. Above 10 Years draws teenage and kidult buyers, shown by Mattel's Brick Shop Hot Wheels Mercedes-Benz 300 SL winning the kidult award in March 2026.
Market Breakup by Distribution Channel
Online Stores lead, in our estimate, and grow fastest at an estimated 5.2% CAGR through 2035, with independent estimates putting online at about a third of sales as trading cards and building sets suit online ordering. Supermarkets and Hypermarkets sell mass market licensed lines, and licensed toys made up 40% of spend in the first half of 2026. Toy Stores keep expert service, shown by Toyworld's plan in June 2025 to return to Mildura. Others include brand websites, department stores and event sales.
Market Breakup by Region
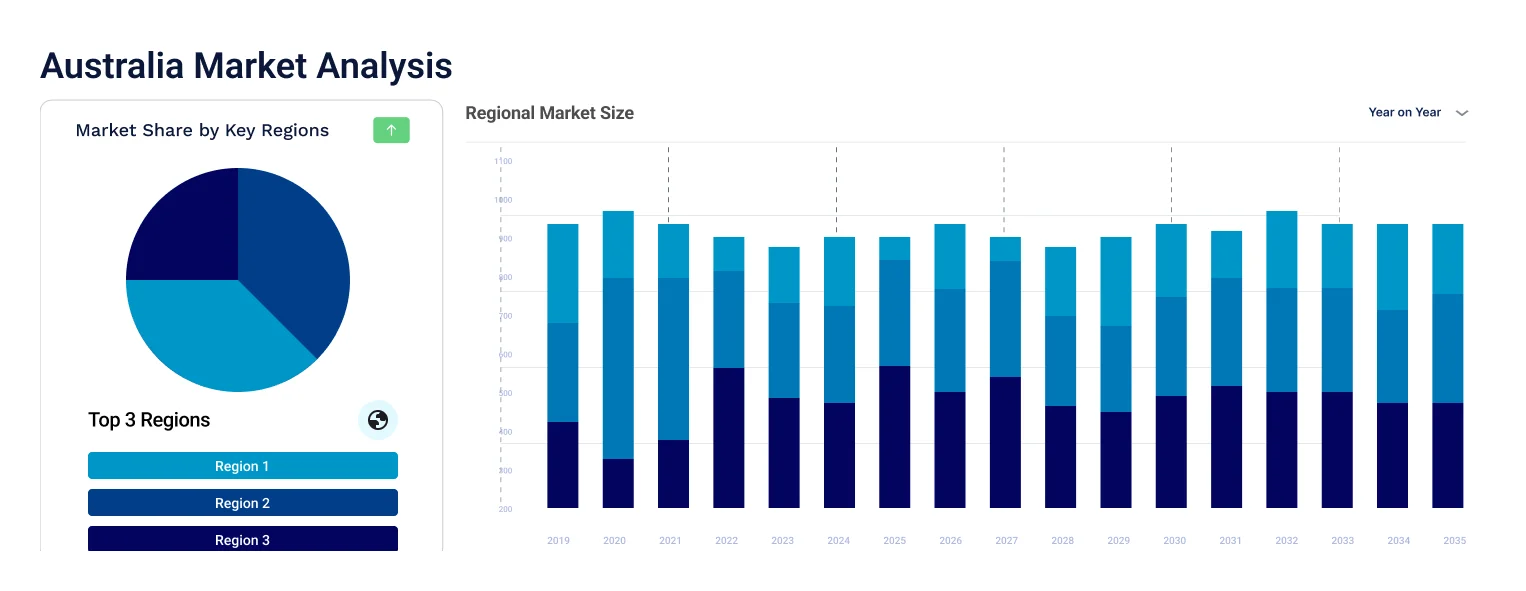
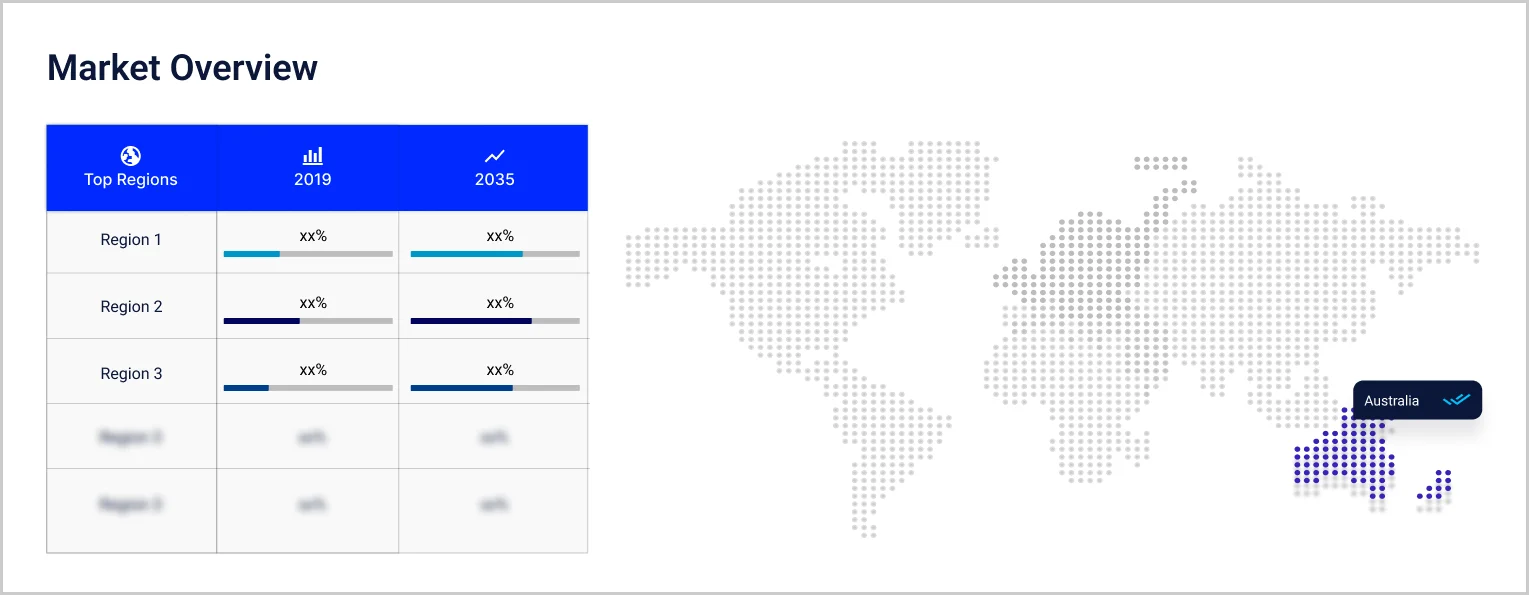
New South Wales dominates, in our estimate, with a 32.8% share in 2025 and an estimated 2.8% CAGR through 2035, as Hasbro Australia operates from Macquarie Park in Sydney. Victoria grows at 2.8% and hosted the sell out Australian Toy Fair in Melbourne in March 2026. Queensland grows at 2.7%, and Western Australia at 3.0%. The Australian Capital Territory is fastest at 3.2%. Rest of Australia grows at 2.6%, covering South Australia, Tasmania and the Northern Territory.
| CAGR 2026 to 2035, Market by Region | Growth Rate |
| New South Wales | 2.8 % |
| Victoria | 2.8 % |
| Queensland | 2.7 % |
| Australia Capital Territory | 3.2 % |
| Western Australia | 3.0 % |
| Others (Rest of Australia) | 2.6 % |
Competition combines global toy makers, licensed distributors, specialist independents and online retailers. Entry barriers include licence access, retailer listings, safety compliance, seasonal inventory risk and the ability to refresh ranges as trends move quickly.
LEGO System A/S
LEGO System A/S belongs to the LEGO Group, a family-owned company headquartered in Billund, Denmark, founded in 1932 by Ole Kirk Kristiansen and selling in more than 120 countries. In Australia, LEGO was a top dollar-gaining manufacturer in the year to July 2025, alongside Banter and Mattel. In March 2026 LEGO Speed Champions Ferrari SF-24 F1 Race Car won Construction Product of the Year at the Australian toy awards, and in August 2026 the group reported record first half revenue of DKK 41.9 billion. Its differentiator is brand led construction play.
Country Toys Australia
Country Toys Australia is named in this report as a participant in the Australian market, but no verifiable public information on its headquarters, products or Australian activity could be confirmed, so no further detail is stated.
Village Toys
Village Toys is a 100% Australian owned family business based in Gerringong, New South Wales, selling educational, traditional and wooden toys online. Its range spans baby and toddler toys, building and construction, games and puzzles, pretend play, sensory toys and bikes, from brands including Grimms, Haba, Hape, Djeco, Janod and Schleich. Orders aim to dispatch within 24 hours, with free shipping over AUD 150. Its differentiator is a curated range selected with early childhood education expertise and not typically found in large department stores.
Hasbro Australia Limited
Hasbro Australia Limited is based at Macquarie Park in Sydney and was incorporated in 1955. It distributes and sells toys, card games and board games, with brands including Transformers, Monopoly, Nerf, Play-Doh and Star Wars. In July 2025 Hasbro appointed Jasnor Australia master toy distributor for Peppa Pig in Australia and New Zealand, and in March 2026 its Beyblade BBX and Nerf Minecraft lines were finalists at the Australian toy awards. Its differentiator is a franchise portfolio.
Other players operating in the Australia toy market include RPG Toms Pty Ltd, alongside independent toy retailers, licensed toy distributors, online sellers and local brands supplying dolls, games, plush and outdoor toys across Australia.
Competition rests on licence access, brand strength, retailer relationships and range freshness rather than price alone. LEGO System A/S and Hasbro Australia Limited anchor construction, preschool and games, while Village Toys serves curated independent demand online. Country Toys Australia and RPG Toms Pty Ltd add further variety. Licence renewals and trade events keep distributors investing in range.


Upto 15% Off
AUD
$2749 $2499
$3849 $3499
$4949 $4499
$6049 $5499


*While we strive to always give you current and accurate information, the numbers depicted on the website are indicative and may differ from the actual numbers in the main report. At Expert Market Research, we aim to bring you the latest insights and trends in the market. Using our analyses and forecasts, stakeholders can understand the market dynamics, navigate challenges, and capitalize on opportunities to make data-driven strategic decisions.*
The Australia toy market is valued at AUD 1.80 billion in 2025, supported by licensed and collectible demand, building set strength and online retail growth.
The market is forecast to reach AUD 2.37 billion by 2035, growing at a CAGR of 2.80 % over the 2026 to 2035 period, driven by licensing, trading card and building set demand and online store growth.
Online Stores record the highest CAGR at an estimated 5.2% through 2035, as trading cards, building sets and licensed lines suit online ordering, while Between 5 to 10 Years leads age groups at an estimated 3.1%.
New South Wales dominates with a 32.8% share in 2025, helped by Hasbro Australia's Sydney base. The Australian Capital Territory is the fastest-growing region at an estimated 3.2% CAGR, while Western Australia is estimated at 3.0%.
Key players include LEGO System A/S, Country Toys Australia, Village Toys, Hasbro Australia Limited, RPG Toms Pty Ltd.
Australian toy sales value rose 13% in the first half of 2026, with units up 7% and average selling prices up 6%, and licensed toys rose 16% to reach 40% of toy spend, as reported from retail tracking data in August 2026.
Awards announced on 2 March 2026 named Bluey overall licence and LeapFrog LeapMove from VTech Electronics Australia overall product of the year, while LEGO Speed Champions Ferrari SF-24 won the Construction award.
Explore our key highlights of the report and gain a concise overview of key findings, trends, and actionable insights that will empower your strategic decisions.
| Report Features | Details |
| Base Year | 2025 |
| Historical Period | 2019-2025 |
| Forecast Period | 2026-2035 |
| Scope of the Report |
Historical and Forecast Trends, Industry Drivers and Constraints, Historical and Forecast Market Analysis by Segment:
|
| Breakup by Type |
|
| Breakup by Age Group |
|
| Breakup by Distribution Channel |
|
| Breakup by Region |
|
| Market Dynamics |
|
| Competitive Landscape |
|
| Companies Covered |
|
Datasheet
AUD 2,749
AUD 2,499
tax inclusive*
Single User License
AUD 3,849
AUD 3,499
tax inclusive*
Five User License
AUD 4,949
AUD 4,499
tax inclusive*
Corporate License
AUD 6,049
AUD 5,499
tax inclusive*
*Please note that the prices mentioned below are starting prices for each bundle type. Kindly contact our team for further details.*
Flash Bundle
Small Business Bundle
Growth Bundle
Enterprise Bundle
*Please note that the prices mentioned below are starting prices for each bundle type. Kindly contact our team for further details.*
Flash Bundle
Number of Reports: 3
20%
tax inclusive*
Small Business Bundle
Number of Reports: 5
25%
tax inclusive*
Growth Bundle
Number of Reports: 8
30%
tax inclusive*
Enterprise Bundle
Number of Reports: 10
35%
tax inclusive*
How To Order

Select License Type
Choose the right license for your needs and access rights.

Click on ‘Buy Now’
Add the report to your cart with one click and proceed to register.

Select Mode of Payment
Choose a payment option for a secure checkout. You will be redirected accordingly.
Strategic Solutions for Informed Decision-Making
Stay upgraded and grab opportunities by strategic insights
Stay informed and aware for a Market Leverage
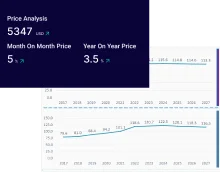
Analyze pricing patterns with comprehensive trend analyses.
Analyse trade data for supply chain insights.
Leverage cost reports for smart savings
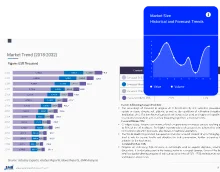
Elevate supply chain with collaboration
Contact Us for Further Information
Our specialized analysts will be available to answer all the pre-purchase and post-purchase queries regarding the report.
Our specialized analysts will be available to answer all the pre-purchase and post-purchase queries regarding the report.
Staying one step ahead of the market landscape with our in-depth research methods, integrating advanced analytics to drive precise and tangible outcomes.
Our expert analyst team offers a significant advantage over competitors, with extensive market insights into the latest trends, putting you strategically ahead.
We deliver a simplified yet extensive report, comprising in-depth industry insights and analytics tailored to your industry requirements.
We are happy to help you navigate through the services we offer and solve your queries.
Contact us