Consumer Insights
Uncover trends and behaviors shaping consumer choices today
Procurement Insights
Optimize your sourcing strategy with key market data
Industry Stats
Stay ahead with the latest trends and market analysis.
The Australia smart home market covers connected hardware, voice assistants, smart appliances and related services that let households monitor and control security, energy, lighting, entertainment and comfort from phones, speakers and hubs. It spans products sold through specialty stores, online platforms and installers. Compared with standalone gadgets, connected systems share data and automate routines across devices, although they depend on compatible standards and sound security.
In 2025, the market is valued at AUD 3.42 billion in 2025 and is forecast to grow at a CAGR of 8.00%, reaching AUD 7.38 billion by 2035. Growth is driven by the Cheaper Home Batteries Program, funded at AUD 7.2 billion over four years, mandatory smart device security rules from 4 March 2026, and Gemini for Home early access from April 2026.
Compound Annual Growth Rate
8%
Value in AUD billion
2026-2035
The Australia smart home market is at an inflection point. Voice speakers and lighting once defined connected homes, but home batteries, security rules and cross-brand control now push households towards energy management and professionally installed systems.
Three forces are shaping the market: policy, with the Cheaper Home Batteries Program funded at AUD 7.2 billion and smart device security rules in force from 4 March 2026; assistants, as Gemini for Home reached Australian early access in April 2026; and energy, with more than 500,000 home batteries installed by August 2026.
In December 2025 Signify made the Hue Bridge Pro available in Australia at AUD 179.95, in March 2026 the Australian Capital Territory reported more than 25,000 Sustainable Household Scheme loans, and in October 2026 Allegion raised its full-year outlook.
The market is moving from single connected gadgets towards energy-aware, professionally installed home systems. Hardware leads because hubs, sensors, locks and lighting sit at the base of every setup, while smart appliances grow quickest among components. Security holds established demand, and energy management grows fastest among applications as home batteries spread. Specialty stores anchor advice-led purchases, and online grows fastest among channels. New South Wales is the biggest region and also grows quickest. Government battery support, security rules and assistant upgrades point to durable growth, although interoperability remains a constraint.
| Metric | Value |
| Market Size 2025 | AUD 3.42 billion |
| Projected Market Size 2035 | AUD 7.38 billion |
| CAGR 2026 to 2035 | 8.00% |
| Fastest-Growing Component | Smart Appliances: 9.1% CAGR |
| Fastest-Growing Application | Energy Management: 9.4% CAGR |
| Largest Revenue Segment 2025 | Hardware |
| Dominant Region | New South Wales |
| Highest CAGR by Region | New South Wales: 9.2% |
| Home batteries installed under the Cheaper Home Batteries Program (August 2026) | More than 500,000 |
Batteries and Security Rules Anchor Growth
Revenue is on course to more than double across the decade, from AUD 3.42 billion in 2025 to AUD 7.41 billion in 2035 at an 8.0% CAGR. Home batteries passing 500,000 installations by August 2026 and mandatory device security rules from March 2026 give suppliers a funded, regulated base for demand.
Smart Appliances and Energy Management Lead Growth
Hardware holds the largest share, but Smart Appliances grow at an estimated 9.1% CAGR and Energy Management at an estimated 9.4% CAGR through 2035. Electrolux Group reported organic sales growth of 3.5% in October 2026, and its Electrolux Life app links connected products.
Assistant Upgrades Reach Australian Homes
Google began Gemini for Home early access in Australia on 10 April 2026, upgrading Google Assistant to Gemini at no extra cost. Premium features such as Gemini Live need a Google Home Premium subscription, while Alexa+ had not launched locally by June 2026.
| Report Summary | Unit | Value |
| Base Year | AUD billion | 2025 |
| Historical Period | AUD billion | 2019 to 2025 |
| Forecast Period | AUD billion | 2026 to 2035 |
| Market Size 2025 | AUD billion | 3.42 |
| Market Size 2035 | AUD billion | 7.38 |
| CAGR 2026 to 2035 | Percentage | 8.00 % |
| CAGR by Component: Smart Appliances | Percentage | 9.1 % |
| CAGR by Application: Energy Management | Percentage | 9.4 % |
| CAGR by Distribution Channel: Online | Percentage | 9.0 % |
| CAGR by Region: New South Wales | Percentage | 9.2 % |
| Households Owning a Smart Home Product by June 2026 | Percentage | 86 |
| Home Batteries Installed by August 2026 | Number | 500,000 |
| Market Share by Region 2025 | New South Wales | Dominant Share |
The trajectory reflects a shift from convenience gadgets to energy and safety systems rather than a passing fashion. Home batteries, device security rules and assistant upgrades give households clear reasons to connect more of the home. Hardware leads on scale, smart appliances and energy management grow quickest, and New South Wales leads and grows fastest among regions. Growth is underpinned by funded government programs and published rules rather than speculative forecasts.
The Australia smart home market is being reshaped by interoperability gaps, home battery uptake, assistant upgrades and mandatory security standards for connected devices.
October 2026 - Interoperability Gaps and AI Trust Shape Smart Home Buying Decisions
August 2026 - Home Battery Installations Pass 500,000 Under the Federal Program
April 2026 - Gemini for Home Reaches Australian Speakers and Displays in Early Access
March 2026 - Mandatory Security Standards Take Effect for Consumer Smart Devices
Interoperability gaps, a federal battery program, assistant upgrades and mandatory security rules show growth that is structurally supported rather than cyclical. Policy, energy costs and artificial intelligence are the main forces. The market stays central to household energy and safety through the forecast period.
Recent developments, presented from the most recent, show Allegion's raised outlook, JB Hi-Fi's full-year result, Sonos quarterly revenue growth and Signify's Hue Bridge Pro launch in Australia.
October 2026 - Allegion Raises 2026 Outlook After Third Quarter Revenue Growth
August 2026 - JB Hi-Fi Reports Full-Year Sales Up 4.8% to AUD 11.06 Billion
July 2026 - Sonos Reports Fiscal Third Quarter Revenue Up 9%
December 2025 - Signify Makes Hue Bridge Pro Available in Australia
Allegion's raised outlook, JB Hi-Fi's full-year result, Sonos revenue growth and Signify's Hue Bridge Pro launch show the market moving from planning to delivery. The Hue Bridge Pro launch and Allegion's results are the flagship events. The momentum validates commercial confidence in connected products, locks and lighting.
The Expert Market Research’s report on the Australia Smart Home Market offers a detailed analysis of the market based on the following segments.
Market Breakup by Component
Hardware leads, in our estimate, because hubs, sensors, locks and lighting form the base of every setup, and Signify made the Hue Bridge Pro available in Australia at AUD 179.95 in December 2025. Smart Appliances grow fastest at an estimated 9.1% CAGR through 2035, as Electrolux Group reported organic sales growth of 3.5% in October 2026 and links products through its Electrolux Life app. AI Speaker demand follows Gemini for Home early access from April 2026. Services Others covers installation and support, where installation revenue rose 87% in 2025, reported in October 2026.
Market Breakup by Application
Security leads, in our estimate, as locks, cameras and access control anchor purchases, and Allegion raised its 2026 outlook in October 2026. Energy Management grows fastest at an estimated 9.4% CAGR through 2035, as the Cheaper Home Batteries Program passed 500,000 installations in August 2026. Smart Appliances connect through brand apps, and Comfort and Lighting is led by Signify's Hue range. Home Entertainment relies on Sonos, which reported revenue of USD 375.3 million in July 2026. Control and Connectivity depends on Matter, known to one in seven Australians in October 2026.
Market Breakup by Distribution Channel
Specialty Stores lead, in our estimate, because shoppers want demonstration and installer advice, and JB Hi-Fi reported full-year revenue of AUD 11,064.0 million in August 2026. Online grows fastest at an estimated 9.0% CAGR through 2035, as online made up more than 17% of sales in both JB Hi-Fi divisions in Australia and New Zealand in August 2026. Others covers professional installers and direct sales by brands, with 79% of upgraders valuing installer advice in October 2026, alongside retailers outside the specialty format.
Market Breakup by Region
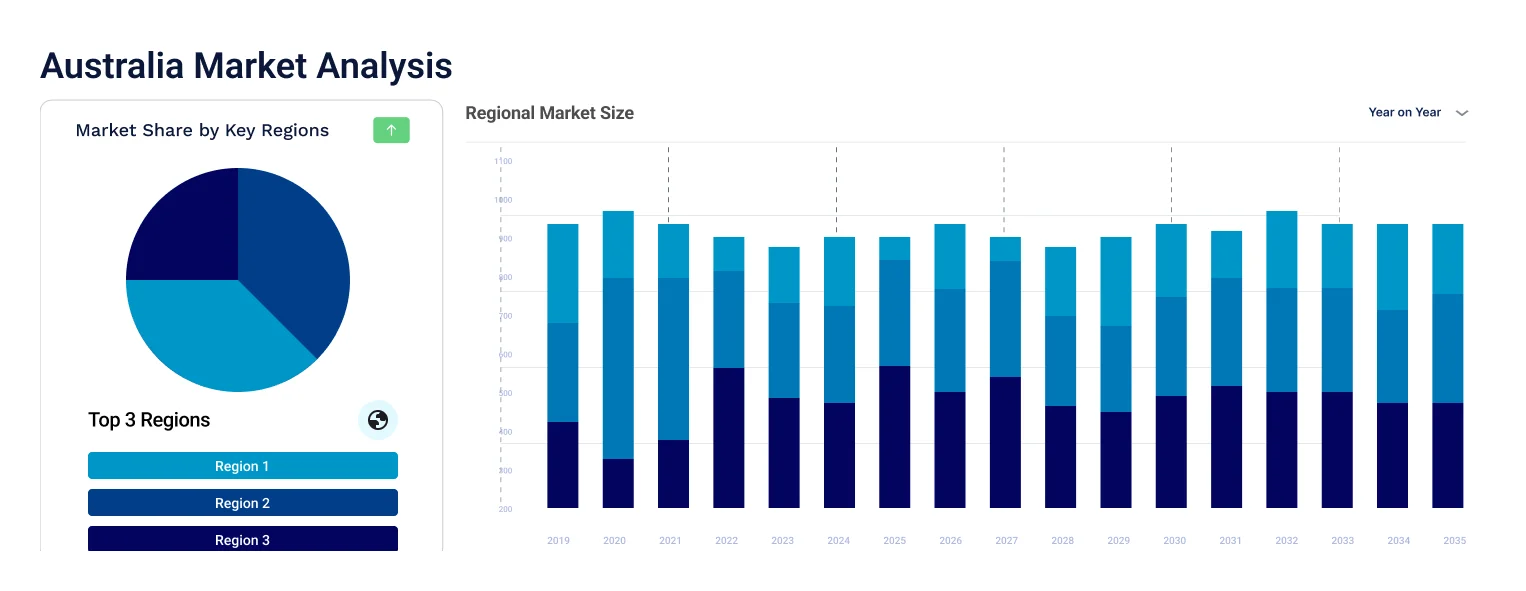
New South Wales dominates, in our estimate, with the largest population, and grows fastest at an estimated 9.2% CAGR through 2035, as Castle Hill marked 500,000 batteries in August 2026. Western Australia grows at 8.0%, with 22,000 batteries by January 2026. Queensland grows at 7.9% and Victoria at 7.6%, where the state battery program delivered about 20,000 systems before the federal scheme replaced it in October 2025. The Australia Capital Territory grows at 7.2%, with just over half of Sustainable Household Scheme applications for batteries in March 2026. Others grow at 6.4%, as Rest of Australia, covering South Australia, Tasmania and the Northern Territory.
| CAGR 2026 to 2035, Market by Region | Growth Rate |
| New South Wales | 9.2 % |
| Victoria | 7.6 % |
| Queensland | 7.9 % |
| Australia Capital Territory | 7.2 % |
| Western Australia | 8.0 % |
| Others (Rest of Australia) | 6.4 % |
Competition combines global audio, lighting, lock and appliance makers, platform companies, retailers and professional installers. Entry barriers include interoperability, brand trust, compliance with the 2026 security rules, retail reach and installer relationships.
Sonos, Inc
Sonos, Inc is headquartered in Santa Barbara, California, and was founded in 2002 as Rincon Audio, and later renamed Sonos. Its portfolio covers wireless speakers such as Era 100, Era 300, Move and Roam, Arc and Beam soundbars, Sub subwoofers and Ace headphones. On 29 July 2026 it reported fiscal third quarter revenue of USD 375.3 million, up 9%, with the Americas largest at USD 238.4 million. Its differentiators are multi-room audio software and home theatre systems.
Signify
Signify is headquartered in Eindhoven, the Netherlands, and was formed in 2016 as Philips Lighting before being renamed Signify in 2018. Its portfolio covers connected lighting under Philips Hue and WiZ alongside professional luminaires. In Australia it made the Hue Bridge Pro available at AUD 179.95 on 19 December 2025, and on 23 October 2026 it reported third quarter sales of EUR 1,367 million. Its differentiators are the Hue ecosystem and a bridge supporting up to 150 lights and 50 accessories.
Allegion Plc
Allegion Plc is headquartered in Dublin, Ireland, and was spun off from Ingersoll Rand in 2013, with 31 global brands including Schlage, LCN and Von Duprin. In Australia, Allegion (Australia) Pty Ltd sells Schlage, Brio, Briton and Gainsborough products, including the Gainsborough Smart Pull Handle with fingerprint reader and backlit keypad launched in the second quarter of 2026. On 22 October 2026 Allegion reported third quarter revenue of USD 1,172.6 million. Its differentiators are local product development and teams in five Australian cities.
Electrolux Home Products Pty Ltd
Electrolux Home Products Pty Ltd, the Australian arm of Electrolux Group, belongs to a company founded in 1919 and headquartered in Stockholm, Sweden. Electrolux bought Email Ltd in 2001, adding Westinghouse, Simpson, Kelvinator, Chef and Dishlex to its Australian brands. Connected products pair with the Electrolux Life app, and on 23 October 2026 the Group reported third quarter net sales of SEK 33,919 million with organic growth of 3.5%. Its differentiators are a broad household range and long local brand heritage.
Other players operating in the Australia smart home market include Brilliant Lighting (Aust) Pty Ltd, Ring LLC, Access Hardware (TAS) Pty Ltd., and Clarke Security Pty Ltd, alongside installers, retailers and energy specialists supplying hubs, cameras, locks and controls across Australia.
Competition rests on interoperability, security compliance, brand trust and installer reach rather than price alone. Sonos, Inc and Signify lead in audio and lighting, Allegion Plc in locks, and Electrolux Home Products Pty Ltd in connected appliances. Brilliant Lighting (Aust) Pty Ltd, Ring LLC, Access Hardware (TAS) Pty Ltd., and Clarke Security Pty Ltd add lighting, camera and hardware depth. Mandatory security rules push global suppliers to build local compliance and support teams.


Upto 15% Off
AUD
$2749 $2499
$3849 $3499
$4949 $4499
$6049 $5499


*While we strive to always give you current and accurate information, the numbers depicted on the website are indicative and may differ from the actual numbers in the main report. At Expert Market Research, we aim to bring you the latest insights and trends in the market. Using our analyses and forecasts, stakeholders can understand the market dynamics, navigate challenges, and capitalize on opportunities to make data-driven strategic decisions.*
The Australia smart home market is valued at AUD 3.42 billion in 2025, supported by home battery uptake, security rules for connected devices and assistant upgrades, with New South Wales the largest region.
The market is forecast to reach AUD 7.38 billion by 2035, growing at a CAGR of 8.00 % over the 2026 to 2035 period, driven by the Cheaper Home Batteries Program, mandatory smart device security standards and Gemini for Home early access.
Smart Appliances record the highest CAGR at an estimated 9.1% through 2035, as brand apps link appliances to home energy and control, while Energy Management leads the applications at an estimated 9.4%.
New South Wales dominates, as it has the largest population, and grows fastest at an estimated 9.2% CAGR. Western Australia follows at an estimated 8.0%, with more than 22,000 home batteries installed by January 2026, while the Australia Capital Territory grows at 7.2%.
Key players include Sonos, Inc, Signify, Allegion Plc, Electrolux Home Products Pty Ltd, Brilliant Lighting (Aust) Pty Ltd, Ring LLC, Access Hardware (TAS) Pty Ltd., Clarke Security Pty Ltd.
Rules under the Cyber Security Act 2024 commenced on 4 March 2026 for devices made from that date. They ban universal default passwords and require a published way to report security issues and a stated security update end date.
The Cheaper Home Batteries Program began in July 2025 and passed 500,000 installations in August 2026. In March 2026 just over half of ACT Sustainable Household Scheme applications were for batteries, up from 10% before July 2025.
Explore our key highlights of the report and gain a concise overview of key findings, trends, and actionable insights that will empower your strategic decisions.
| Report Features | Details |
| Base Year | 2025 |
| Historical Period | 2019-2025 |
| Forecast Period | 2026-2035 |
| Scope of the Report |
Historical and Forecast Trends, Industry Drivers and Constraints, Historical and Forecast Market Analysis by Segment:
|
| Breakup by Component |
|
| Breakup by Application |
|
| Breakup by Distribution Channel |
|
| Breakup by Region |
|
| Market Dynamics |
|
| Competitive Landscape |
|
| Companies Covered |
|
Datasheet
AUD 2,749
AUD 2,499
tax inclusive*
Single User License
AUD 3,849
AUD 3,499
tax inclusive*
Five User License
AUD 4,949
AUD 4,499
tax inclusive*
Corporate License
AUD 6,049
AUD 5,499
tax inclusive*
*Please note that the prices mentioned below are starting prices for each bundle type. Kindly contact our team for further details.*
Flash Bundle
Small Business Bundle
Growth Bundle
Enterprise Bundle
*Please note that the prices mentioned below are starting prices for each bundle type. Kindly contact our team for further details.*
Flash Bundle
Number of Reports: 3
20%
tax inclusive*
Small Business Bundle
Number of Reports: 5
25%
tax inclusive*
Growth Bundle
Number of Reports: 8
30%
tax inclusive*
Enterprise Bundle
Number of Reports: 10
35%
tax inclusive*
How To Order

Select License Type
Choose the right license for your needs and access rights.

Click on ‘Buy Now’
Add the report to your cart with one click and proceed to register.

Select Mode of Payment
Choose a payment option for a secure checkout. You will be redirected accordingly.
Strategic Solutions for Informed Decision-Making
Stay upgraded and grab opportunities by strategic insights
Stay informed and aware for a Market Leverage
Analyze pricing patterns with comprehensive trend analyses.
Analyse trade data for supply chain insights.
Leverage cost reports for smart savings
Elevate supply chain with collaboration
Contact Us for Further Information
Our specialized analysts will be available to answer all the pre-purchase and post-purchase queries regarding the report.
Our specialized analysts will be available to answer all the pre-purchase and post-purchase queries regarding the report.
Staying one step ahead of the market landscape with our in-depth research methods, integrating advanced analytics to drive precise and tangible outcomes.
Our expert analyst team offers a significant advantage over competitors, with extensive market insights into the latest trends, putting you strategically ahead.
We deliver a simplified yet extensive report, comprising in-depth industry insights and analytics tailored to your industry requirements.
We are happy to help you navigate through the services we offer and solve your queries.
Contact us