Consumer Insights
Uncover trends and behaviors shaping consumer choices today
Procurement Insights
Optimize your sourcing strategy with key market data
Industry Stats
Stay ahead with the latest trends and market analysis.
The Australia furniture and home furnishing market covers retail sales of furniture, soft furnishings, bedding, rugs, lighting, decorative homewares and related accessories through furniture stores, department stores, franchised multi-category retailers and specialist showrooms. These products fit out houses and apartments and are bought for comfort, storage and style. Compared with furniture manufacturing, the market is measured at retail level, so store formats, ownership structures and consumer confidence shape results more than factory output.
In 2025, the market is valued at AUD 14.63 billion in 2025 and is forecast to grow at a CAGR of 4.50%, reaching AUD 22.72 billion by 2035. Growth is driven by franchised retail scale, with Harvey Norman system sales passing AUD 5 billion in the first half of FY26, department store home ranges, with Myer home sales up 5.6% in FY26, and a deeper housing pipeline, as South Australia approved 15,308 dwellings in the year to July 2026.
Compound Annual Growth Rate
4.5%
Value in AUD billion
2026-2035
The Australia furniture and home furnishing market is at an inflection point. Franchised multi-category retailers and department stores once set the pace, but private equity backed chains, merged specialists and AI shopping assistants now compete for the same household budget, while interest rates keep shoppers selective.
Three forces are shaping the market: franchise scale, with Harvey Norman first half system sales up 6.9% to above AUD 5 billion; department store resilience, with Myer home sales up 5.6% in FY26; and retail consolidation, with Amart acquiring Freedom Furniture to form a group of around 120 stores.
In June 2025 Amart agreed to acquire Freedom Furniture, in February 2026 Harvey Norman reported first half net profit of AUD 321.9 million, and in August 2026 Adairs reported FY26 revenue of AUD 641.7 million.
The market is moving from single category showrooms towards multi category groups that combine furniture, bedding and home furnishings under one brand or one roof. Furniture stores hold the largest share because furniture carries higher ticket values, while home furnishing grows faster as lower priced, more frequent purchases attract younger households. Inclusive retailers and dealers grow quickest among store types, and retail chains outpace independent stores through scale. New South Wales is the largest region, and the Australia Capital Territory grows quickest. Franchise networks, department store ranges and online tools support durable demand, although interest rates and cautious budgets keep spending selective.
| Metric | Value |
| Market Size 2025 | AUD 14.63 billion |
| Projected Market Size 2035 | AUD 22.72 billion |
| CAGR 2026 to 2035 | 4.50% |
| Fastest-Growing Store Type | Inclusive Retailers /Dealers: 5.3% CAGR |
| Fastest-Growing Type | Home Furnishing: 4.7% CAGR |
| Largest Revenue Segment 2025 | Furniture Stores |
| Dominant Region | New South Wales |
| Highest CAGR by Region | Australia Capital Territory: 5.2% |
| Harvey Norman system sales growth (company results, first half FY26) | 6.9% |
Franchise Scale and Department Stores Anchor Growth
Revenue is on course to rise from AUD 14.63 billion in 2025 to AUD 22.72 billion in 2035 at a 4.5% CAGR. Harvey Norman first half system sales up 6.9% and Myer home sales up 5.6% show that multi category retailers still capture a large share of household spending.
Inclusive Retailers and Home Furnishing Grow Fastest
Inclusive Retailers /Dealers grow at an estimated 5.3% CAGR and Home Furnishing at an estimated 4.7% CAGR through 2035, both ahead of the market. Adairs reported Mocka sales up 22.9% in FY26, showing demand for lower priced online home ranges.
Consolidation Reshapes Chains and Independents
Amart announced its acquisition of Freedom Furniture in June 2025, and Adairs said in August 2026 that Focus on Furniture would open no new stores, so chains are rationalising formats as they scale. Independent stores compete on service and local ranges.
| Report Summary | Unit | Value |
| Base Year | AUD billion | 2025 |
| Historical Period | AUD billion | 2019 to 2025 |
| Forecast Period | AUD billion | 2026 to 2035 |
| Market Size 2025 | AUD billion | 14.63 |
| Market Size 2035 | AUD billion | 22.72 |
| CAGR 2026 to 2035 | Percentage | 4.50 % |
| CAGR by Type: Home Furnishing | Percentage | 4.7 % |
| CAGR by Store Type: Inclusive Retailers /Dealers | Percentage | 5.3 % |
| CAGR by Ownership: Retail Chains | Percentage | 4.8 % |
| CAGR by Region: Australia Capital Territory | Percentage | 5.2 % |
| Harvey Norman Half Year System Sales Growth | Percentage | 6.9 |
| Myer Home Category Sales Growth in FY26 | Percentage | 5.6 |
| Market Share by Region 2025 | New South Wales | Dominant Share |
The outlook reflects retail consolidation, franchise scale and steady household demand rather than a single cycle. Furniture stores hold the largest revenue, home furnishing grows faster from lower ticket sizes, and inclusive retailers outpace specialist showrooms. Retail chains gain ground on independent stores through buying power and omnichannel investment, while the Australia Capital Territory and Western Australia grow fastest among regions. The growth path rests on reported retailer results rather than speculative assumptions.
The Australia furniture and home furnishing market is being reshaped by resilient department store ranges, interest rate settings, AI-assisted shopping tools and consolidation among global suppliers.
September 2026 - Department Store Home Ranges Outperform Within a Soft Retail Year
August 2026 - Reserve Bank Holds the Cash Rate and Keeps Big Ticket Buyers Cautious
June 2026 - Bunnings Plans Direct Selling Inside Google AI Mode
December 2025 - HNI Completes Steelcase Acquisition and Reshapes Contract Furniture Supply
Resilient department store ranges, cautious interest rate settings and AI-led discovery are changing where and how households buy furnishings. Supplier consolidation in contract furniture adds scale at the top of the chain. Retailers that pair strong ranges with digital search should hold share in a selective market.
Recent developments, presented from the most recent, show Adairs' FY26 result, Ashley's Texas job cuts, Harvey Norman's half year result and Amart's agreement to acquire Freedom Furniture.
August 2026 - Adairs Reports FY26 Revenue of AUD 641.7 Million and Plans Store Changes
March 2026 - Ashley Plans 266 Job Cuts at Its Mesquite Texas Plant
February 2026 - Harvey Norman Reports Higher First Half Profit as Franchise Sales Grow
June 2025 - Amart Agrees to Acquire Freedom Furniture From Greenlit Brands
Adairs' store reset, Ashley's footprint changes, Harvey Norman's franchise growth and the Amart and Freedom combination show operators adjusting formats rather than pulling back. Scale players invest while weaker formats are trimmed. These events validate steady demand for furnishings through multi category groups.
The Expert Market Research’s report on the Australia Furniture and Home Furnishing Market offers a detailed analysis of the market based on the following segments.
Market Breakup by Type
Furniture Stores lead, in our estimate, because sofas, beds and dining sets carry higher ticket values, and Amart announced the acquisition of Freedom Furniture in June 2025, creating a group of around 120 stores. Home Furnishing grows fastest at an estimated 4.7% CAGR through 2035, as Adairs reported Mocka sales up 22.9% in FY26 in August 2026. Home Furnishing also covers bedding, rugs, lighting and decorative homewares bought more often than furniture, although Adairs said in August 2026 that Focus on Furniture would open no new stores.
Market Breakup by Store Type
Exclusive /Retail Showrooms lead, in our estimate, because dedicated brand showrooms let buyers test products, and Adairs planned 7 to 10 new stores, 4 to 6 refurbishments and 2 to 5 closures for FY27, reported in August 2026. Inclusive Retailers /Dealers grow fastest at an estimated 5.3% CAGR through 2035, as Harvey Norman first half system sales rose 6.9% to above AUD 5 billion, reported in February 2026, with Australian franchisee sales up 4.8% to AUD 3.5 billion. Inclusive formats sell furniture alongside appliances, bedding and technology under one roof.
Market Breakup by Ownership
Retail Chains lead, in our estimate, because scale supports buying power, delivery networks and digital investment, and Amart's June 2025 acquisition of Freedom Furniture created a group with turnover of nearly AUD 1 billion. Retail Chains grow fastest at an estimated 4.8% CAGR through 2035, while Myer reported Home category sales up 5.6% in FY26 in September 2026. Independent Stores compete on service, local design and curated ranges, and face a market in which the Reserve Bank held the cash rate at 4.35% in August 2026, keeping households cautious about large purchases.
Market Breakup by Region
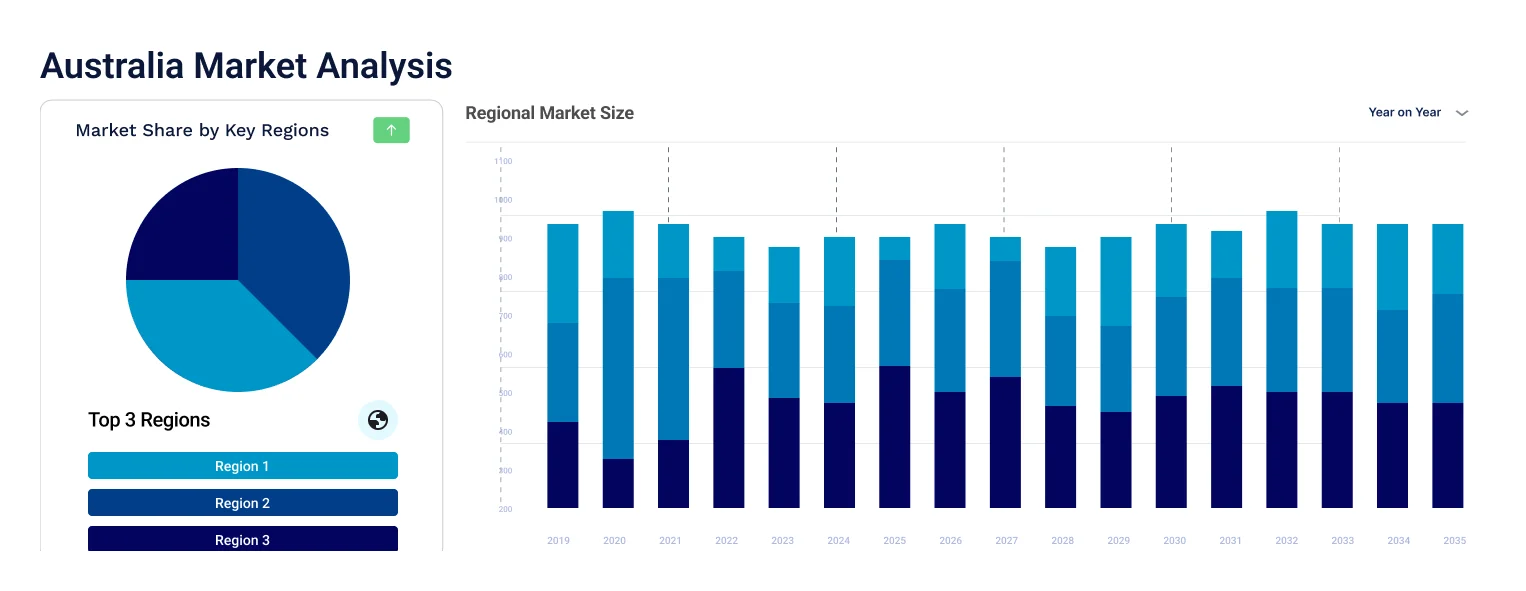
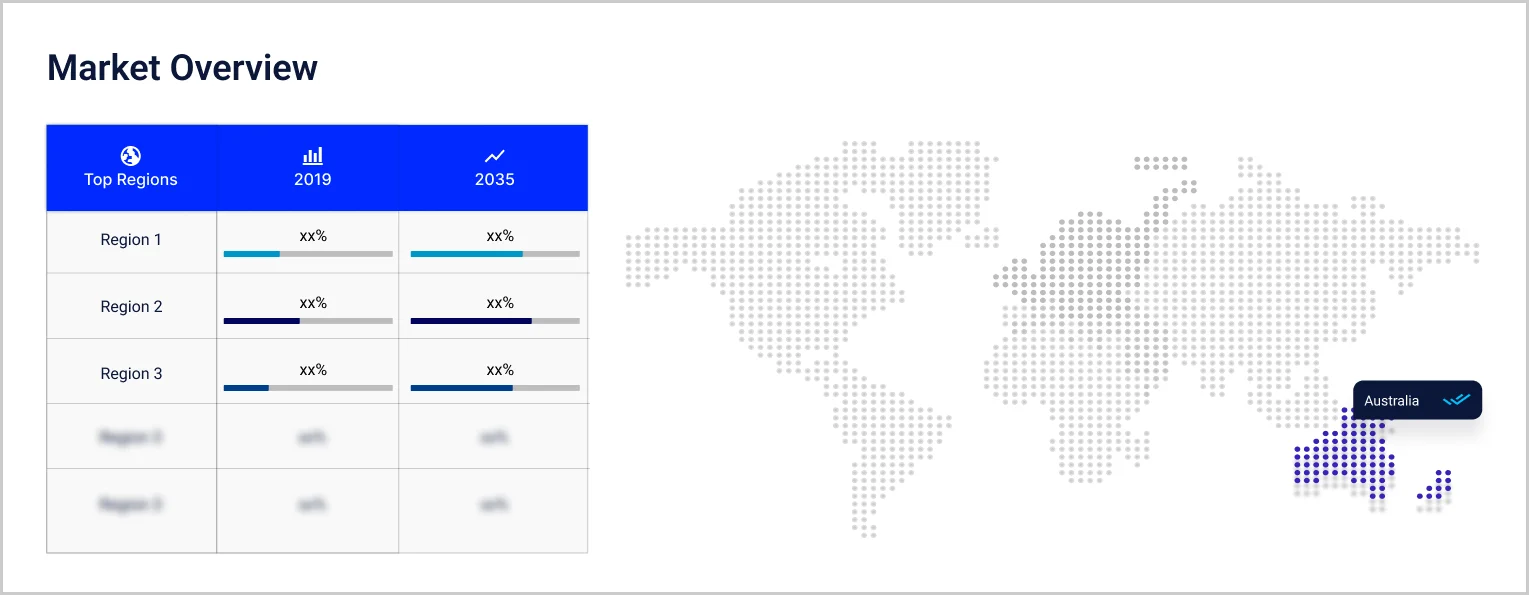
New South Wales dominates, in our estimate, as the largest population and retail base, with Sydney CBD office vacancy at 13.6% in October 2026 data, and grows at an estimated 4.4% CAGR through 2035. The Australia Capital Territory grows fastest at 5.2%, with 579 dwellings approved in December 2025, reported in February 2026, and Western Australia at 5.1%, with 1,832 private houses approved in September 2026. Victoria grows at 4.6%, with 2,895 houses approved, and Queensland at 4.5%, with 2,407. Rest of Australia grows at 4.3%, covering South Australia, Tasmania and the Northern Territory, where South Australia approved 1,646 dwellings in September 2026.
| CAGR 2026 to 2035, Market by Region | Growth Rate |
| New South Wales | 4.4 % |
| Victoria | 4.6 % |
| Queensland | 4.5 % |
| Australia Capital Territory | 5.2 % |
| Western Australia | 5.1 % |
| Others (Rest of Australia) | 4.3 % |
Competition combines a franchised electrical and furniture retailer, global furniture groups, a franchised flat-pack concept and contract furniture suppliers. Entry barriers include store networks, supplier relationships, delivery capability, brand recognition and the working capital needed for large ticket inventory.
Ashley Furniture Industries, Inc.
Ashley Furniture Industries, Inc. is headquartered in Arcadia, Wisconsin, in the United States, and was founded in 1945 in Chicago. Its portfolio covers upholstered furniture and casegoods, plus home furnishings, accessories and mattresses sold through its HomeStore chain. Ashley planned to cut 266 jobs at its Mesquite, Texas, plant by 7 May 2026, as it optimised its manufacturing footprint and moved production to other plants. Its differentiators are vertical integration, a large manufacturing base and a retail chain that sells its own ranges.
Harvey Norman Holdings
Harvey Norman Holdings is headquartered in Homebush West, Sydney, and the Harvey Norman brand was founded in 1982 by Gerry Harvey and Ian Norman. It mainly operates as a franchise, with franchisees running separate departments for furniture, bedding, electrical goods, computers and appliances in each store. In the first half of FY26 it reported system sales above AUD 5 billion, and overseas after-tax profit of AUD 92 million, up 35.6%, with progress on a UK flagship at Merry Hill. Its differentiators are franchise scale, property ownership and multi category stores.
MillerKnoll, Inc.
MillerKnoll, Inc. is headquartered in Zeeland, Michigan, and was formed through the merger of Herman Miller and Knoll. Its portfolio includes Herman Miller, Knoll, Design Within Reach, HAY, Muuto, Maharam and Holly Hunt, spanning office, residential and retail furnishings. In the fourth quarter of fiscal 2026 it reported net sales of USD 1.004 billion, up 4.4%, with orders of USD 971.5 million, and it guided fiscal 2027 to 14 to 18 new retail stores. Its differentiators are design heritage, a company owned retail network and a contract dealer base.
Inter IKEA Systems B.V.
Inter IKEA Systems B.V. is headquartered in Delft, the Netherlands, and provides franchisees with the IKEA concept, trademarks and operating requirements. Inter IKEA Group reported FY25 total revenues of EUR 26,306 million and net income of EUR 1,496 million, down from EUR 2,199 million a year earlier. In Australia, IKEA's FY25 summary released on 2 February 2026 reported more than 3,800 co-workers and 78.4% of customer truck orders delivered by zero-emission vehicles. Its differentiators are a global franchise system, low price positioning and a broad home furnishing range.
Other players operating in the Australia furniture and home furnishing market include Haworth Inc., Papaya Pty Ltd., and Steelcase Inc., alongside department stores, specialist homewares chains, online retailers and independent showrooms supplying furniture and furnishings across Australia.
Competition rests on store reach, range depth and price rather than a single advantage. Harvey Norman competes through franchise scale and multi category stores, Inter IKEA through a franchised flat-pack concept, and Ashley and MillerKnoll through manufacturing and design. Harvey Norman's February 2026 result and Adairs' August 2026 store reset show operators investing selectively. Retailers that combine delivery reliability and digital search should hold share.


Upto 15% Off
AUD
$2749 $2499
$3849 $3499
$4949 $4499
$6049 $5499


*While we strive to always give you current and accurate information, the numbers depicted on the website are indicative and may differ from the actual numbers in the main report. At Expert Market Research, we aim to bring you the latest insights and trends in the market. Using our analyses and forecasts, stakeholders can understand the market dynamics, navigate challenges, and capitalize on opportunities to make data-driven strategic decisions.*
The Australia furniture and home furnishing market is valued at AUD 14.63 billion in 2025, supported by franchise retail scale, resilient department store home ranges and a deep housing pipeline, with New South Wales as the largest region.
The market is forecast to reach AUD 22.72 billion by 2035, growing at a CAGR of 4.50 % over the 2026 to 2035 period, driven by franchised retail scale, department store home ranges and online and AI-assisted shopping tools.
Inclusive Retailers /Dealers record the highest CAGR at an estimated 5.3% through 2035, as franchised multi category groups add furniture sales to appliance traffic, while Home Furnishing leads types at an estimated 4.7% CAGR.
New South Wales dominates, as it has the largest population and retail base, and grows at an estimated 4.4% CAGR. The Australia Capital Territory is the fastest-growing region at an estimated 5.2%, followed by Western Australia at 5.1%.
Key players include Ashley Furniture Industries, Inc., Harvey Norman Holdings, MillerKnoll, Inc., Inter IKEA Systems B.V., Haworth Inc., Papaya Pty Ltd., Steelcase Inc.
Adairs reported on 24 August 2026 group revenue of AUD 641.7 million, up 3.8%, with Mocka sales up 22.9% while Focus on Furniture sales fell 5.6%, and the company plans no new Focus on Furniture stores in FY27.
The Reserve Bank held the cash rate at 4.35% on 11 August 2026, and Myer reported on 23 September 2026 that comparable sales rose only 0.7% for FY26, although its Home category grew 5.6%.
Explore our key highlights of the report and gain a concise overview of key findings, trends, and actionable insights that will empower your strategic decisions.
| Report Features | Details |
| Base Year | 2025 |
| Historical Period | 2019-2025 |
| Forecast Period | 2026-2035 |
| Scope of the Report |
Historical and Forecast Trends, Industry Drivers and Constraints, Historical and Forecast Market Analysis by Segment:
|
| Breakup by Type |
|
| Breakup by Store Type |
|
| Breakup by Ownership |
|
| Breakup by Region |
|
| Market Dynamics |
|
| Competitive Landscape |
|
| Companies Covered |
|
Datasheet
AUD 2,749
AUD 2,499
tax inclusive*
Single User License
AUD 3,849
AUD 3,499
tax inclusive*
Five User License
AUD 4,949
AUD 4,499
tax inclusive*
Corporate License
AUD 6,049
AUD 5,499
tax inclusive*
*Please note that the prices mentioned below are starting prices for each bundle type. Kindly contact our team for further details.*
Flash Bundle
Small Business Bundle
Growth Bundle
Enterprise Bundle
*Please note that the prices mentioned below are starting prices for each bundle type. Kindly contact our team for further details.*
Flash Bundle
Number of Reports: 3
20%
tax inclusive*
Small Business Bundle
Number of Reports: 5
25%
tax inclusive*
Growth Bundle
Number of Reports: 8
30%
tax inclusive*
Enterprise Bundle
Number of Reports: 10
35%
tax inclusive*
How To Order

Select License Type
Choose the right license for your needs and access rights.

Click on ‘Buy Now’
Add the report to your cart with one click and proceed to register.

Select Mode of Payment
Choose a payment option for a secure checkout. You will be redirected accordingly.
Strategic Solutions for Informed Decision-Making
Stay upgraded and grab opportunities by strategic insights
Stay informed and aware for a Market Leverage
Analyze pricing patterns with comprehensive trend analyses.
Analyse trade data for supply chain insights.
Leverage cost reports for smart savings
Elevate supply chain with collaboration
Contact Us for Further Information
Our specialized analysts will be available to answer all the pre-purchase and post-purchase queries regarding the report.
Our specialized analysts will be available to answer all the pre-purchase and post-purchase queries regarding the report.
Staying one step ahead of the market landscape with our in-depth research methods, integrating advanced analytics to drive precise and tangible outcomes.
Our expert analyst team offers a significant advantage over competitors, with extensive market insights into the latest trends, putting you strategically ahead.
We deliver a simplified yet extensive report, comprising in-depth industry insights and analytics tailored to your industry requirements.
We are happy to help you navigate through the services we offer and solve your queries.
Contact us