Consumer Insights
Uncover trends and behaviors shaping consumer choices today
Procurement Insights
Optimize your sourcing strategy with key market data
Industry Stats
Stay ahead with the latest trends and market analysis.
Compound Annual Growth Rate
5.9%
Value in AUD billion
2026-2035
The food service market in Australia refers to an industry that handles the preparation, packaging and distribution of food and beverages, it includes chain and independent outlets mainly café, bars, full-service restaurants, and quick-service restaurants. They aim to provide high-quality services to fulfil their nutritional and personal requirements which eventually drives the Australia foodservice market.
| Australia Foodservice Market Report Summary | Description | Value |
| Base Year | AUD billion | 2025 |
| Historical Period | AUD billion | 2019-2025 |
| Forecast Period | AUD billion | 2026-2035 |
| Market Size 2025 | AUD billion | 72.90 |
| Market Size 2035 | AUD billion | 129.33 |
| CAGR 2019-2025 | Percentage | XX% |
| CAGR 2026-2035 | Percentage | 5.90% |
| CAGR 2026-2035 - Market by Region | Australian Capital Territory | 6.7% |
| CAGR 2026-2035 - Market by Region | Queensland | 5.3% |
| CAGR 2026-2035 - Market by Food Service Type | Cloud Kitchen | 6.6% |
| CAGR 2026-2035 - Market by Outlet | Chained Outlets | 6.4% |
| Market Share by Region | Western Australia | 15.8% |
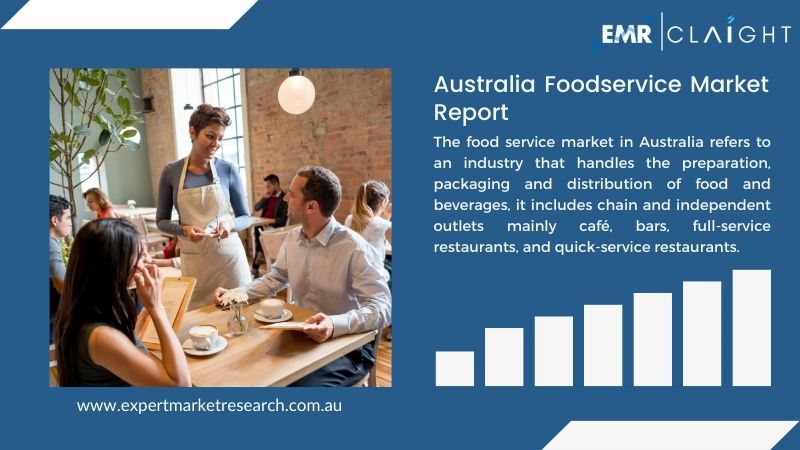
The proportion of food and beverage budget spent by Australians on eating out has increased from 13.7% in 2021 to 30.3% in 2023, thus, driving the Australia foodservice market growth.
The Australia foodservice market is growing with the adoption of vegan food, revolutionizing innovation, technological advancements, and sustainable restaurants.
Encouraging the Australia foodservice market developments prompts companies to innovate technologies for operational efficiency and traceability. For instance, NCS Australia introduces the FreshFocus ERP solution.
Consumers seek protein-rich, plant-based options for health and environmental reasons. To meet demand, businesses like Vegan Food Hub in Australia aim to expand via crowd equity funding.
Innovations in the Australia foodservice market, like autonomous robot waiters, are emerging. For instance, a Canberra café utilizes robots for food and drink delivery, also in warehouses and inventory management.
To mitigate carbon footprints and adopt green energy, Australia has seen the rise of sustainable restaurants like RE Cocktail Bar (Sydney), Four Pillars Healesville (Yarra Valley), and Blume (Boonah).
McDonald's has launched CosMc’s, a new retro-style restaurant that will focus on iced beverages and iced drinks.
Perrier is a natural sparkling mineral water brand that has entered into a distribution partnership agreement with DKSH.
Australia and Cambodia have launched a partnership to support agri-food small and medium-sized enterprises, a new food innovation partnership to improve their market reach, develop new products, and meet food safety standards.
Angel Food, a New Zealand-based plant-based food brand has launched a crowdfunding campaign to expand in Australia.
The development and innovation have encouraged organisations and brands to implement enterprise resource planning solutions to enhance their operations, functions, and traceability. Individuals adopting plant-based food to improve their health has led to the establishment of sustainable restaurants that are environmentally friendly.
Autonomous robot waiters have been implemented by companies to use in their warehouses, inventory, retail, and hospitality businesses to lessen the need for human staff indicating the increase in Australia foodservice market demand.
"Australia Foodservice Market Report and Forecast 2026-2035" offers a detailed analysis of the market based on the following segments:
Market Breakup by Food Service Type
Market Breakup by Outlet
Market Breakup by Region
Based on foodservice type, Australia foodservice market share is led by quick-service restaurants
The quick service restaurants serve food that takes less time to prepare and is quick and very cheap and their mobile and digital technology has also made it convenient for individuals, they have their food delivered to their door. Café restaurants provide comfortable sitting areas and have a self-service option which offers a casual setting and relaxed environment for business meetings.
The Australia foodservice market growth is driven by chained outlets
Chained outlets provide various types of food and beverage options to individuals to cater for their diverse tastes and preferences, they are convenient as they take less time to prepare and are very quick.
Companies have a large network of outlets offering pizza delivery and takeaways, offer a variety of breakfast options and other fast-food items and create a significant impact through their social responsibility efforts.
Domino's Pizza Enterprises Limited, founded in 1960 and headquarters in the United States, has a large network of outlets offering pizza delivery and takeaways while offering convenient ordering options and reliable services.
McDonald's Australia Limited, founded in 1940 and headquartered in the United States, offers a variety of breakfast options and other fast-food items through its franchise network.
Zambrero Pty Ltd, founded in 2005 and headquarters in Australia, serves Mexican cuisine and creates a significant impact through its social responsibility efforts.
Nando’s Australia Pty Ltd, founded in 1990 and headquartered in Australia, offers Portuguese-style flame-grilled chicken dishes and food catering services in Australia.
*Please note that this is only a partial list; the complete list of key players is available in the full report. Additionally, the list of key players can be customized to better suit your needs.*
Other Australia foodservice market key players are Bloomin’ Brands, Inc., Guzman y Gomez (Holdings) Limited, Hunter St. Hospitality, PubCo Group, and Ribs & Burgers, among others.
The Australia foodservice market growth is propelled by increased quick-service restaurants in Australia, as they offer home delivery services and take less time to prepare which makes it convenient for individuals.
Liquor licensing provides substantial revenue to the state government with Queensland receiving AUD 20 million in 2018-19 whereas New South Wales received AUD 18 million in 2018-19 respectively, which indicates the growth of the Australia foodservice market.
| CAGR 2026-2035 - Market by | Region |
| Australian Capital Territory | 6.7% |
| Queensland | 5.3% |
| New South Wales | 4.7% |
| Victoria | XX% |
| Western Australia | XX% |
| Others | XX% |


Upto 15% Off
AUD
$2749 $2499
$3849 $3499
$4949 $4499
$6049 $5499


*While we strive to always give you current and accurate information, the numbers depicted on the website are indicative and may differ from the actual numbers in the main report. At Expert Market Research, we aim to bring you the latest insights and trends in the market. Using our analyses and forecasts, stakeholders can understand the market dynamics, navigate challenges, and capitalize on opportunities to make data-driven strategic decisions.*
The market is projected to grow at a CAGR of 5.90% between 2026 and 2035.
Based on the outlet, the foodservice market is bifurcated into chained and independent outlets.
Key players in the industry are Domino's Pizza Enterprises Limited, McDonald's Australia Limited, Zambrero Pty Ltd, Nando’s Australia Pty Ltd, Bloomin’ Brands, Inc., Guzman y Gomez (Holdings) Limited, Hunter St. Hospitality, PubCo Group, and Ribs & Burgers, among others.
Based on foodservice type, the foodservice market is divided into cafes & bars, cloud kitchen, full-service restaurants, quick-service restaurants, and others.
The different food services in the market include waiter service, buffet service, self-service, and semi-self-service.
The market is broken down into several regions such as New South Wales, Victoria, Queensland, Australian Capital Territory, Western Australia, and others.
In 2025, the Australia foodservice market reached an approximate value of AUD 72.90 billion.
The market is estimated to witness healthy growth in the forecast period of 2026-2035 to reach a value of around AUD 129.33 billion by 2035.
Explore our key highlights of the report and gain a concise overview of key findings, trends, and actionable insights that will empower your strategic decisions.
| Report Features | Details |
| Base Year | 2025 |
| Historical Period | 2019-2025 |
| Forecast Period | 2026-2035 |
| Scope of the Report |
Historical and Forecast Trends, Industry Drivers and Constraints, Historical and Forecast Market Analysis by Segment:
|
| Breakup by Food Service Type |
|
| Breakup by Outlet |
|
| Breakup by Region |
|
| Market Dynamics |
|
| Competitive Landscape |
|
| Companies Covered |
|
Datasheet
AUD 2,749
AUD 2,499
tax inclusive*
Single User License
AUD 3,849
AUD 3,499
tax inclusive*
Five User License
AUD 4,949
AUD 4,499
tax inclusive*
Corporate License
AUD 6,049
AUD 5,499
tax inclusive*
*Please note that the prices mentioned below are starting prices for each bundle type. Kindly contact our team for further details.*
Flash Bundle
Small Business Bundle
Growth Bundle
Enterprise Bundle
*Please note that the prices mentioned below are starting prices for each bundle type. Kindly contact our team for further details.*
Flash Bundle
Number of Reports: 3
20%
tax inclusive*
Small Business Bundle
Number of Reports: 5
25%
tax inclusive*
Growth Bundle
Number of Reports: 8
30%
tax inclusive*
Enterprise Bundle
Number of Reports: 10
35%
tax inclusive*
How To Order

Select License Type
Choose the right license for your needs and access rights.

Click on ‘Buy Now’
Add the report to your cart with one click and proceed to register.

Select Mode of Payment
Choose a payment option for a secure checkout. You will be redirected accordingly.
Strategic Solutions for Informed Decision-Making
Stay upgraded and grab opportunities by strategic insights
Stay informed and aware for a Market Leverage
Analyze pricing patterns with comprehensive trend analyses.
Analyse trade data for supply chain insights.
Leverage cost reports for smart savings
Elevate supply chain with collaboration
Contact Us for Further Information
Our specialized analysts will be available to answer all the pre-purchase and post-purchase queries regarding the report.
Our specialized analysts will be available to answer all the pre-purchase and post-purchase queries regarding the report.
Staying one step ahead of the market landscape with our in-depth research methods, integrating advanced analytics to drive precise and tangible outcomes.
Our expert analyst team offers a significant advantage over competitors, with extensive market insights into the latest trends, putting you strategically ahead.
We deliver a simplified yet extensive report, comprising in-depth industry insights and analytics tailored to your industry requirements.
We are happy to help you navigate through the services we offer and solve your queries.
Contact us