

Consumer Insights
Uncover trends and behaviors shaping consumer choices today
Procurement Insights
Optimize your sourcing strategy with key market data
Industry Stats
Stay ahead with the latest trends and market analysis.
Base Year
Historical Year
Forecast Year


Value in AUD billion
2026-2035
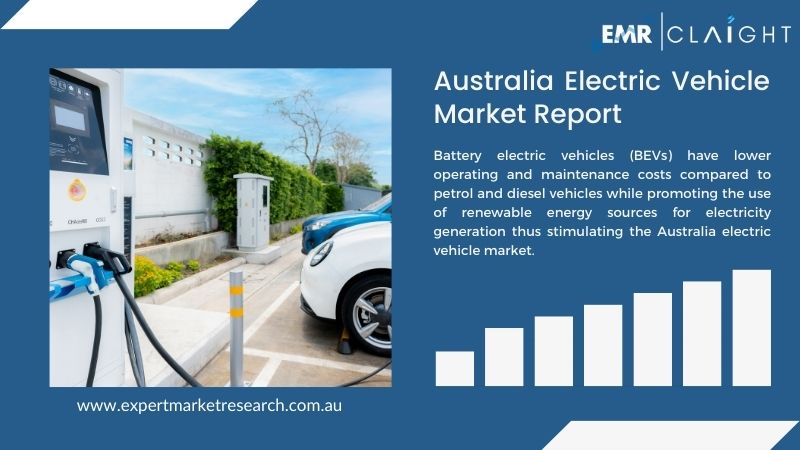
Australia Electric Vehicle Market Outlook
*this image is indicative*
|
156,753 Units Total EV Sales 2025 (BEV + PHEV) |
13. 1% EV Share of New Car Market 2025 |
|
454,000+ Total EV Fleet on Australian Roads |
1,272 Sites Fast Charging Locations Nationwide (H1 2025) |
Quick Answer
The Australia electric vehicle market covers the purchase, deployment, and operation of battery electric vehicles (BEVs) and plug-in hybrid electric vehicles (PHEVs) across passenger, commercial, and fleet segments. In 2025, a record 156,753 electrified vehicles were sold (103,269 BEVs + 53,484 PHEVs), representing 13.1 per cent of new car sales, up from 9.5 per cent in 2024 (FCAI and Electric Vehicle Council). BEV sales crossed 100,000 for the first time; PHEV sales more than doubled. Australia's total EV fleet surpassed 454,000 vehicles. Growth is anchored by the New Vehicle Efficiency Standard (NVES, from 1 January 2025), the AUD 475 million Driving the Nation Fund, and the Climate Change Authority's requirement that half of new cars sold 2025-2035 be electric. The electric vehicle market is projected to reach AUD 55.72 billion by 2035 at a 20.0 per cent CAGR.
The Australia electric vehicle market reached a structural milestone in 2025 that the automotive industry had been tracking for several years: BEV annual sales broke through the 100,000-unit barrier for the first time, reaching 103,269 units per FCAI and EVC data released in January 2026. Combined with 53,484 PHEVs (a staggering 130.9 per cent increase year-on-year), the total electrified vehicle market reached 156,753 units. EVs claimed 13.1 per cent of all new car sales in 2025, compared with 9.5 per cent in 2024 and 5.0 per cent in 2022. Australia's total EV fleet now stands at more than 454,000 vehicles.
Despite the headline volume record, the composition of growth in 2025 was notable. BEV market share growth was described by FCAI chief executive Tony Weber as 'anaemic', gaining just 0.9 percentage points from 7.4 per cent in 2024 to 8.3 per cent. PHEV sales were the genuine standout, with buyers opting for petrol backup to manage range anxiety in an electric vehicle market where public charging, while expanding, still falls well short of demand. The NRMA's 2025 member survey found half of respondents would not buy an EV in the future, up from about a third in 2024, with charging infrastructure and price the dominant concerns.
Three structural forces will determine the pace of growth in the Australia electric vehicle market through the forecast period. First, the NVES is requiring manufacturers to progressively lower fleet-average CO2 emissions, creating a supply-side mandate. Second, the AUD 475 million Driving the Nation Fund is deploying 117 highway charging stations, dealership chargers, and heavy vehicle hubs. Third, the Electric Car Discount FBT exemption, credited with aiding ~100,000 EV purchases since 2022, is under statutory review, creating policy uncertainty weighing on fleet decisions.
| Metric | Value |
| BEV Sales 2025 | 103,269 Units (+13.1% YoY) |
| PHEV Sales 2025 | 53,484 Units (+130.9% YoY) |
| Total EV Sales 2025 | 156,753 Units (+38.7% YoY) |
| EV Market Share 2025 (BEV+PHEV) | 13.1% (2024: 9.5%) |
| Estimated Electric Vehicle Market Value 2025 | AUD 9.00 Billion |
| Projected Electric Vehicle Market Value 2035 (20% CAGR) | AUD 55.72 Billion |
| CAGR 2026 to 2035 | 20.0% |
| Total New Vehicle Market 2025 | 1,209,808 Units |
| Total EV Fleet on Australian Roads | 454,000+ Vehicles |
| Hybrid Sales 2025 | 199,133 Units (+15.3%) |
| BEV Models Available in Australia 2025 | 110 Models |
| Deloitte: EV Market Share Forecast 2033 | 43% of New Car Sales |
| Climate Change Authority EV Fleet Target 2035 | 5 Million+ Vehicles |
| NVES Fuel Savings (to 2050) | AUD 95 Billion |
| Driving the Nation Fund | AUD 475 Million |
| Public Fast Charging Sites (H1 2025) | 1,272 / 4,192 Plugs |
| Public EV Chargers Needed by 2033 | 27,500+ (Deloitte) |
The 100,000 BEV Milestone Is Commercially Significant But Structurally Insufficient
Australia's first-ever annual BEV sales figure above 100,000 units is a market milestone. At the same time, the FCAI chief executive's frank assessment that BEV market share growth of 0.9 percentage points over two years is 'anaemic' is equally accurate. Reaching 13.1 per cent total EV penetration (BEV + PHEV) stands well below the trajectory required to reach the Climate Change Authority's target of 50 per cent by the mid-2030s. The structural divergence between PHEV sales growing at 130.9 per cent and BEV sales growing at 13.1 per cent tells a consumer confidence story: Australians are moving toward electrification but at a pace constrained by BEV price premiums and persistent gaps in public charging outside capital cities.
Chinese Brands Are Reshaping the Competitive Landscape
Chinese-origin brands supplied 77.5 per cent of all BEVs sold in Australia in 2025. BYD's 77.3 per cent year-on-year growth brought it within 3,569 units of Tesla in BEV-only sales, and BYD's total Australian volume (52,415 units including PHEVs) already exceeds Tesla's by a wide margin. Tesla's BEV market share has fallen from 53 per cent in 2023 to 42 per cent in 2024 to 28 per cent in 2025 as Chinese brands expand model ranges and price points. The BYD Atto 1 at AUD 23,990 sets a new affordability benchmark that will define competitive positioning in the electric vehicle market through the forecast period.
Charging Infrastructure Scale-Up Is the Biggest Operational Constraint
Fast-charging locations grew 22 per cent in H1 2025 alone to 1,272 sites. But Deloitte Australia's analysis indicates 27,500 new public chargers will be needed by 2033: an eight-fold increase. Approximately 75 per cent of Australians do not have access to home charging (they rent or live in apartments) and face a fundamentally different calculus than garage-equipped homeowners. The Driving the Nation Fund's AUD 475 million, ARENA's AUD 266 million allocation, and NRMA's National Highway Network are the federal response, but state-level and kerbside deployment has to scale much faster to support the Climate Change Authority's 5 million EV target by 2035.
Key Insight
The Australia electric vehicle market is no longer supply-constrained in the way it was in 2022 and 2023, when wait times of six months to a year were common. In 2025, most models had reasonable availability, and the constraint on growth has shifted firmly to demand-side factors: price parity with equivalent petrol vehicles, accessible public charging, and consumer confidence in the technology for long-distance travel. The entry of BYD's Atto 1 at AUD 23,990 in late 2025 and the expected arrival of sub-AUD 25,000 models in 2026 represent the most important demand-side catalysts for the forecast period.
NVES First Performance Period Complete, December 2025
Australia's first-ever New Vehicle Efficiency Standard completed its first performance period on 31 December 2025, with results published by the NVES Regulator. The standard requires manufacturers to meet progressively stricter fleet-average CO2 targets: 141g/km for passenger vehicles in 2025, 108g/km by 2029, and ~81g/km from 2033. Projected by DCCEEW to reduce transport CO2 by 321 million tonnes by 2050 and save motorists AUD 95 billion in fuel costs. By 2030, the NVES is projected to reduce new passenger car emissions by over 60 per cent and halve light commercial vehicle emissions compared with 2024.
BYD Overtakes Competitive Landscape, 2025
BYD's total Australian volume reached 52,415 units in 2025, more than 80 per cent above Tesla's 28,856 deliveries when PHEVs are included. BEV-only sales put BYD within 3,569 units of Tesla, with 77.3 per cent year-on-year growth implying potential overtaking in 2026. BYD's model range spans affordable hatchbacks (Dolphin, Atto 1 from AUD 23,990), mid-size SUVs (Sealion 7, Atto 2), performance sedans (Seal), and utes (Shark 6), covering more of the market than any other EV brand. The premium sub-brand Denza launched two models in 2025.
Electric Car Discount Under Review, 2025
The Australian Centre for Evaluation within Treasury commenced a statutory review of the Electric Car Discount (ECD) in 2025, creating policy uncertainty that is already weighing on fleet purchase decisions. The ECD, an FBT exemption for eligible zero and low emission vehicles below the Luxury Car Tax threshold through novated leases or fleet arrangements, has been in force since July 2022. FCAI and NALSPA credit it with aiding ~100,000 EV purchases. Treasury estimates the programme will cost AUD 23.4 billion in lost revenue if it continues unchanged to the mid-2030s. PHEVs lost ECD eligibility on 1 April 2025.
Market Breakup by Powertrain
Market Breakup by Region
The Australia electric vehicle market is characterised by a clear split between Chinese-origin brands driving volume and affordability, and established Western and Korean brands holding loyalty in higher price segments. The NVES is accelerating brand entries and model availability.
Tesla
Australia's highest-volume BEV brand in 2025 for the third consecutive year at 28,856 deliveries, despite a 24.8 per cent year-on-year decline. Market share has fallen from 53 per cent in 2023 to 28 per cent in 2025 as Chinese brands expanded. The Model Y remains Australia's best-selling EV at 22,239 units. The Supercharger network, now open to all EVs, remains an important infrastructure asset.
BYD
The most consequential competitive disruptor in the Australia electric vehicle market. BYD's 25,287 BEV units trailed Tesla by just 3,569 in 2025, with 77.3 per cent growth. Total Australian volume including PHEVs (Shark 6 at 18,073 units) reached 52,415. Model range covers affordable hatchbacks through premium sedans and utes. The Atto 1 at AUD 23,990 sets a new affordability benchmark.
Kia and Hyundai
The Korean duopoly is the most credible established non-Chinese competitor to Tesla. Kia's EV5 delivered 4,787 units in 2025 (+687.3 per cent), ranking fourth in BEV model sales. Total Kia BEV volume reached 7,384. Both brands benefit from strong dealer networks and ANCAP five-star safety ratings.
MG Motor and Other Chinese Brands
MG had been the third-largest BEV brand before losing ground in 2025 as newer BYD, Geely, and others entered. Geely's EX5 finished fifth in annual BEV model sales. New entrants Deepal and GAC began or expanded operations. Chinese brands supplied 77.5 per cent of all BEVs sold.
Other significant participants include BMW (i3, i4, iX), Volkswagen Group (ID.4), Volvo (EX30, EX40, EX90), Mercedes-Benz (EQ range), and Polestar (2, 3, 4). Charging infrastructure is led by ChargeFox, Tesla Supercharger, Jolt, Evie Networks, BP Pulse, and NRMA.
*While we strive to always give you current and accurate information, the numbers depicted on the website are indicative and may differ from the actual numbers in the main report. At Expert Market Research, we aim to bring you the latest insights and trends in the market. Using our analyses and forecasts, stakeholders can understand the market dynamics, navigate challenges, and capitalize on opportunities to make data-driven strategic decisions.*
Get in touch with us today for customized, data-driven solutions tailored to your unique requirements!
A record 156,753 electrified vehicles (103,269 BEVs + 53,484 PHEVs), a 38.7 per cent increase over 2024's total of 113,419. EVs captured 13.1 per cent of the new car market.
The NVES is Australia's first national standard for vehicle CO2 emissions, commenced 1 January 2025. Fleet-average CO2 targets: 141g/km for passenger vehicles in 2025, tightening to 108g/km (2029) and ~81g/km from 2033. By 2030, NVES is projected to reduce new passenger car emissions by over 60 per cent compared with 2024.
An Australian Government FBT exemption for eligible zero and low emission vehicles below the Luxury Car Tax threshold through novated leases or fleet arrangements, in force since July 2022. Has aided ~100,000 vehicle purchases. PHEVs lost eligibility from 1 April 2025. The ECD is under Treasury statutory review.
Deloitte Australia projects EV market share of 43 per cent of new car sales by 2033. The Climate Change Authority requires half of all light vehicles sold between 2025 and 2035 to be electric, implying 5 million-plus EVs on Australian roads by 2035, ~20 times the current fleet. AEMO projects 80 per cent EV penetration of the vehicle fleet by 2050.
Fast-charging network reached 1,272 locations with 4,192 plugs by mid-2025, up 22 per cent in H1. NSW leads with 357 locations. The Driving the Nation Fund (AUD 475 million) is funding the NRMA National Highway Network and heavy vehicle hubs. Deloitte estimates 27,500 new public chargers will be needed by 2033.
The regional markets for the product include New South Wales, Victoria, Queensland, Australian Capital Territory, and Western Australia, others.
Tesla led BEV sales with 28,856 deliveries in 2025 (28 per cent BEV share, down from 42 per cent). BYD was second at 25,287 BEVs, with total Australian volume of 52,415 including PHEVs. The top BEV model was the Tesla Model Y (22,239 units). Chinese-made vehicles accounted for 77.5 per cent of all BEVs sold.
Explore our key highlights of the report and gain a concise overview of key findings, trends, and actionable insights that will empower your strategic decisions.
| Report Features | Details |
| Base Year | 2025 |
| Historical Period | 2019-2025 |
| Forecast Period | 2026-2035 |
| Scope of the Report |
Historical and Forecast Trends, Industry Drivers and Constraints, Historical and Forecast Market Analysis by Segment:
|
| Breakup by Vehicle Type |
|
| Breakup by Powertrain Type |
|
| Breakup by Charging Infrastructure Type |
|
| Breakup by Region |
|
| Market Dynamics |
|
| Trade Data Analysis |
|
| Price Analysis |
|
| Competitive Landscape |
|
| Companies Covered |
|
How To Order
Our step-by-step guide will help you select, purchase, and access your reports swiftly, ensuring you get the information that drives your decisions, right when you need it.

Select License Type
Choose the right license for your needs and access rights.

Click on ‘Buy Now’
Add the report to your cart with one click and proceed to register.

Select Mode of Payment
Choose a payment option for a secure checkout. You will be redirected accordingly.
Pricing Plans


One User
Five Users
Unlimited Users
Connect For More Information
Our expert team of analysts will offer full support and resolve any queries regarding the report, before and after the purchase.
Our expert team of analysts will offer full support and resolve any queries regarding the report, before and after the purchase.
We employ meticulous research methods, blending advanced analytics and expert insights to deliver accurate, actionable industry intelligence, staying ahead of competitors.
Our skilled analysts offer unparalleled competitive advantage with detailed insights on current and emerging markets, ensuring your strategic edge.
We offer an in-depth yet simplified presentation of industry insights and analysis to meet your specific requirements effectively.
Why Choose Us
We ensure that you get unmatchable competitive advantage by providing detailed insights about the existing market scenario as well as the emerging and high growth markets.
Regions and Countries with the Highest Number of Returning Clients
85%
Projects delivered with customization
90%
Projects involving industry specific expertise
24x7
Analysts Support
500+
Corporates choose us as their preferred partner
Commitment to Excellence
Diverse Teams
Innovative Solutions
Client Centric Approach
Continuous Improvement

Subscribe to our Newsletter
By subscribing you agree to with our privacy policy and provide
consent to
receive
updates
from our company.

United States (Head Office)
30 North Gould Street, Sheridan, WY 82801
+1-415-325-5166
Australia
63 Fiona Drive, Tamworth, NSW
+61 448 06 17 27
India
C130 Sector 2 Noida, Uttar Pradesh 201301
+91-120-433-0800
Philippines
40th Floor, PBCom Tower, 6795 Ayala Avenue Cor V.A Rufino St. Makati City,1226.
+63 287899028, +63 967 048 3306
United Kingdom
6 Gardner Place, Becketts Close, Feltham TW14 0BX, Greater London
+44-753-713-2163
Vietnam
193/26/4 St.no.6, Ward Binh Hung Hoa, Binh Tan District, Ho Chi Minh City
+84865399124


