

Consumer Insights
Uncover trends and behaviors shaping consumer choices today
Procurement Insights
Optimize your sourcing strategy with key market data
Industry Stats
Stay ahead with the latest trends and market analysis.
Base Year
Historical Year
Forecast Year


Value in AUD billion
2026-2035
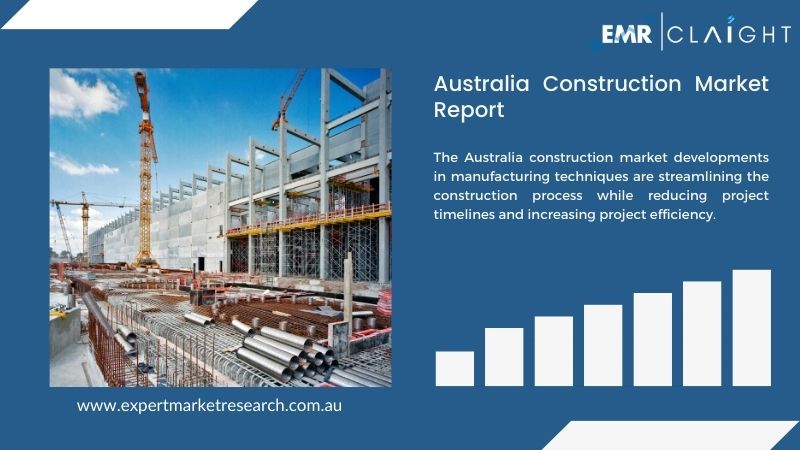
Australia Construction Market Outlook
*this image is indicative*
|
AUD 320 Billion Annual Total Construction Work Done (ABS, Dec 2025) |
AUD 1.14 Trillion 5-Year Total Construction Pipeline (IA 2025) |
|
AUD 242 Billion 5-Year Major Public Infrastructure Pipeline |
141,000 Construction Worker Shortage (October 2025) |
Quick Answer
The Australia construction market encompasses residential building, non-residential building, and engineering construction (roads, railways, utilities, energy infrastructure, and mining). ABS reports a quarterly trend estimate of ~AUD 80 billion in total construction work done as at December 2025, annualising to ~AUD 320 billion. Infrastructure Australia identifies AUD 1.14 trillion of total construction demand across public and private investment for FY 2024-2025 to FY 2028-2029. Growth is driven by engineering construction, particularly utilities, renewables, data centres, defence, and health, while residential lags the National Housing Accord's 1.2 million target. The construction market is projected to reach AUD 451.43 billion by 2035 at a 3.5 per cent CAGR, with a 141,000-worker shortfall (October 2025) the defining delivery constraint.
The Australia construction market is one of the biggest parts of the national economy, and right now it's in an unusual position: more work than it can physically deliver. Infrastructure Australia's 2025 Infrastructure Market Capacity Report (November 2025) identifies AUD 1.14 trillion of total construction demand across public and private investment for the five years from FY 2024-2025 to FY 2028-2029, the highest-volume pipeline in five years of annual tracking. The Major Public Infrastructure Pipeline, government-funded projects tracked at the project level, has grown to AUD 242 billion over five years, a record high and 14 per cent above the prior year.
Engineering construction is doing the heavy lifting in 2025. Total construction work done grew 3.1 per cent year-on-year in Q3 2025, but engineering construction grew 6.1 per cent year-on-year in H1, driven by utilities, energy, and transport projects. Building construction grew 2.1 per cent in the same period: positive, but reflecting a residential sector recovering slowly from a genuinely difficult few years. By September 2025, building work done had risen 3.8 per cent to AUD 43.2 billion. The direction is up across the Australia construction market, though pace varies significantly by segment.
Housing is where the policy pressure is most acute. The National Housing Accord, signed by federal and state governments and the building market in 2023, set a target of 1.2 million new dwellings by 30 June 2029, requiring 240,000 new starts every year from July 2024. Australia commenced roughly 176,000 new dwellings in FY 2023-2024 per the Productivity Commission, well short of target. The NHSAC's 2025 State of the Housing System projects only 938,000 dwellings will actually be built by mid-2029, putting the shortfall at 262,000. The gap is real, it's large, and the structural reasons aren't going away quickly.
| Metric | Value |
| Annual Total Construction Work Done (Dec 2025 annualised) | ~AUD 320 Billion |
| Projected Construction Market Value 2035 (3.5% CAGR) | AUD 451.43 Billion |
| CAGR 2026 to 2035 | 3.5% |
| 5-Year Total Construction Pipeline (FY 2024-2025 to FY 2028-2029) | AUD 1.14 Trillion |
| Major Public Infrastructure Pipeline (5 Years) | AUD 242 Billion (Record, +14% YoY) |
| Renewable Energy Construction Pipeline (5 Years) | AUD 163 Billion |
| Transport Infrastructure Peak Year | ~AUD 50 Billion (FY 2025-2026) |
| Electricity Construction by 2030 Annual | Above AUD 25 Billion (+33%) |
| Housing Construction Expenditure (Year to June 2024) | AUD 139 Billion |
| National Housing Accord Target | 1.2 Million Dwellings by June 2029 |
| NHSAC 2025 Projection vs Target | 938,000 (262,000 Shortfall) |
| Dwelling Commencements Q3 2025 | 48,778 (+6.6% QoQ) |
| Annual Dwelling Commencements FY 2023-2024 | ~176,000 (Worst Decade) |
| Construction Worker Shortage (October 2025) | 141,000 |
| Projected Peak Worker Shortage (Mid-2027) | 300,000+ |
| Construction Insolvencies Growth 2024 | +65.9% YoY (11 Months) |
| Building Construction Price Rise (2020-2024) | +31.1% |
The Pipeline Is at a Record High but the Market Cannot Yet Deliver It
Infrastructure Australia's 2025 Market Capacity Report was prepared at the direct request of the Prime Minister and all Premiers and Chief Ministers, which tells you how seriously governments are taking capacity questions. The five-year Major Public Infrastructure Pipeline is AUD 242 billion, a record since tracking began in 2020. Total construction demand across public and private investment hits AUD 1.14 trillion for FY 2024-2025 to FY 2028-2029. The pipeline itself isn't the problem: total construction work done across the five years from FY 2020-2021 to FY 2024-2025 was AUD 1.4 trillion, so the forward pipeline is actually slightly below recent actuals. The capacity to deliver it is the real constraint.
The Housing Shortfall Is Structurally Embedded and Economically Damaging
The National Housing Accord's 1.2 million target is probably the most consequential housing policy commitment in Australia's post-war history, and it's almost certain not to be met. The NHSAC projects 938,000 dwellings (262,000 shortfall); the UDIA puts the capital city shortfall at 400,000 by 2029; the HIA says 60,960 fewer homes were commenced in FY 2024-2025 than needed annually to hit the target. The Productivity Commission's 2025 research found dwelling construction contributed ~3 per cent of GDP annually over the past decade, with expenditure reaching AUD 139 billion in the year to June 2024. The structural barriers (planning delays, materials costs up 31-41 per cent since 2020, insolvency rates 65 per cent above the prior year, a 90,000-worker shortage per BuildSkills Australia) aren't temporary shocks.
Renewables and Data Centres Are the New Long-Cycle Growth Drivers
The AUD 163 billion renewable energy construction pipeline over five years, mostly privately funded solar, wind, transmission, and pumped hydro, represents a structural expansion of engineering construction demand that will extend well beyond the forecast period. Oxford Economics projects electricity construction growing 33 per cent-plus to above AUD 25 billion annually by 2030. Data centres are adding a new typology: the AUD 100-plus billion hyperscaler pipeline brings facilities with high power density, liquid cooling, and long-term PPA requirements. Water-related construction has risen 55 per cent in real terms over three years. Defence harbour and base construction is beginning a new AUKUS-driven cycle.
Key Insight
Infrastructure Australia's 2025 Market Capacity Report finds demand has increased 14 per cent on the prior year to a record AUD 242 billion for the five-year public pipeline, reinforced by the parallel finding that the worker shortage is deepening and peaking later than previously projected. The Australia construction market faces an unprecedented demand surge at precisely the moment its capacity is most constrained. Resolving this paradox requires productivity-enhancing investment (Modern Methods of Construction, modular building, digital twins, AI-driven project management) rather than simply adding workers to a labour pool that doesn't exist.
Several things happened simultaneously in FY 2024-2025 that define the Australia construction industry's current character. Residential was recovering but well below policy targets. The public infrastructure pipeline hit record highs. Renewable energy emerged as the dominant new engineering workload. And Infrastructure Australia's annual capacity report documented a 141,000-worker shortfall getting worse, not better.
Infrastructure Australia 2025 Market Capacity Report, November 2025
Infrastructure Australia released its 2025 Market Capacity Report in November 2025: the fifth consecutive annual assessment of supply and demand in the Australian construction sector, and the most significant to date. The report confirmed the five-year Major Public Infrastructure Pipeline at a record AUD 242 billion, with total construction demand from public and private sources at AUD 1.14 trillion for FY 2024-2025 to FY 2028-2029. CEO Adam Copp didn't soften the message: governments are doubling down on energy transmission and housing while continuing major transport projects, and the added demand will not come without challenges: productivity growth remains sluggish, and worker shortages present significant delivery risk.
National Housing Accord: Severe Shortfall Against 1.2 Million Target
The Accord, signed by governments and industry in 2023, targets 1.2 million well-located new homes by 30 June 2029, backed by a AUD 43 billion commitment to 55,000 social and affordable homes under Homes for Australia. The gap between ambition and deliverable reality is the problem. NHSAC 2025 projects 938,000 dwellings (262,000 shortfall); UDIA forecasts 400,000 fewer in capital cities by 2029; Master Builders Australia confirmed 158,690 FY 2023-2024 starts, the weakest in over a decade. The Productivity Commission's 2025 paper is blunt: no or negligible labour productivity growth in dwelling construction. ABS September 2025 showed commencements rising 6.6 per cent to 48,778, and residential work done was 8.0 per cent higher year-on-year in the December 2025 quarter. The trend is turning, from a structurally low base.
Construction Insolvency Crisis and Cost Escalation, 2023-2025
Companies filing for insolvency in the sector rose 48.8 per cent in 2023 and a further 65.9 per cent year-on-year in the first 11 months of 2024. The root cause was a collision most in the sector saw coming: fixed-price contracts signed during the pandemic, when materials and labour costs looked stable, ran into a cost escalation cycle that pushed building construction prices up 31.1 per cent between September 2020 and June 2024 and house construction costs up 40.8 per cent. Large residential and commercial builders across Queensland, Victoria, and NSW went into liquidation. Construction unemployment fell to a record low of 3.2 per cent in early 2025: tight labour market plus skills shortage plus pipeline expansion is a difficult combination.
Market Breakup by Sector
Market Breakup by State and Territory
The Australia construction market has a small number of large, integrated contractors capable of managing major public infrastructure and complex building projects, sitting above a very large base of 80,000-plus SMEs that supply specialist trades, materials, and sub-contract services. The majors can't function without them, and the health of the SME tier directly affects the capacity of the sector as a whole.
CPB Contractors
Australia's largest civil infrastructure and engineering contractor, a division of CIMIC Group (ASX: CIM). On most of the country's largest transport projects: Sydney Metro, NorthConnex, Melbourne Metro Tunnel, Snowy 2.0. Covers road, rail, tunnelling, marine, and resources construction nationally.
Lendlease Group
One of Australia's largest integrated property and construction groups, active across building, infrastructure, and urban development. Primary contractor on major hospital, commercial, and mixed-use projects. Genuine commitments to modular and industrialised construction through off-site manufacturing.
John Holland
Major contractor across civil infrastructure, rail, and building; majority-owned by China Communications Construction Company. Key projects include Melbourne Metro Tunnel, Geelong Fast Rail, and Cross River Rail. Moving into data centre and utilities construction as transport moderates.
Laing O'Rourke
Private UK-origin contractor with significant Australian operations. The most consistent advocate for Modern Methods of Construction and Design for Manufacture and Assembly. Active across transport, health, energy, and commercial. Arguably best positioned for any government MMC procurement push.
Downer Group
ASX: DOW. A leading integrated services provider for transport and infrastructure sectors, covering roads, rail, and utilities maintenance and construction. Active in road and rail maintenance, providing counter-cyclical stability alongside capital works.
Other significant participants include Multiplex (Brookfield), Built Environs, BMD Group, Georgiou Group, Besix Watpac, Hansen Yuncken, and Fulton Hogan. The 80,000-plus SMEs underpin all of this: they supply the trades workforce and specialist sub-contracting that major projects depend on.
*While we strive to always give you current and accurate information, the numbers depicted on the website are indicative and may differ from the actual numbers in the main report. At Expert Market Research, we aim to bring you the latest insights and trends in the market. Using our analyses and forecasts, stakeholders can understand the market dynamics, navigate challenges, and capitalize on opportunities to make data-driven strategic decisions.*
Get in touch with us today for customized, data-driven solutions tailored to your unique requirements!
An agreement between Australian governments and industry to build 1.2 million new well-located homes between July 2024 and June 2029, requiring 240,000 annual starts. The evidence overwhelmingly indicates the target will not be met: NHSAC projects 938,000 (262,000 shortfall); UDIA projects 400,000-dwelling shortfall for capital cities; FY 2023-2024 commencements were the weakest in over a decade.
A concurrent pipeline of housing, transport, renewables, hospitals, data centres, and water projects competing for the same workers; structural undersupply of trained tradespeople; and renewable energy projects concentrated in thin-workforce regional areas. BuildSkills Australia estimates the sector needs 90,000 extra workers for housing alone, before the renewables pipeline adds demand.
Transport (AUD 129 billion over five years): Sydney Metro, Melbourne Metro Tunnel, Cross River Rail, METRONET, Bruce Highway upgrades. Utilities (AUD 36 billion), dominated by renewable energy transmission. Buildings (AUD 77 billion) including social housing and hospitals. The private renewable energy pipeline adds AUD 163 billion.
Elevated and likely to stay that way. Building construction prices rose 31.1 per cent between September 2020 and June 2024; house construction costs rose 40.8 per cent. With 141,000-300,000 workers short of pipeline needs, labour cost pressure isn't going away over the forecast period.
The market is broken down into New South Wales, Victoria, Queensland, Australian Capital Territory, Western Australia, and others.
ABS puts total construction work done at ~AUD 80.2 billion per quarter in December 2025, annualising to ~AUD 320 billion. Construction accounts for 8-9 per cent of Australian GDP and employs over one million people directly.
Released in November 2025 by Infrastructure Australia (the nation's independent statutory infrastructure adviser at the request of the Prime Minister and all Premiers and Chief Ministers), it's the authoritative annual assessment of construction industry supply and demand. Key findings: the five-year Major Public Infrastructure Pipeline is at a record AUD 242 billion, total construction demand is AUD 1.14 trillion, and the 141,000 worker shortage is projected to surge past 300,000 by mid-2027.
Explore our key highlights of the report and gain a concise overview of key findings, trends, and actionable insights that will empower your strategic decisions.
| Report Features | Details |
| Base Year | 2025 |
| Historical Period | 2019-2025 |
| Forecast Period | 2026-2035 |
| Scope of the Report |
Historical and Forecast Trends, Industry Drivers and Constraints, Historical and Forecast Market Analysis by Segment:
|
| Breakup by Construction Sector |
|
| Breakup by End Use |
|
| Breakup by Type of Construction Activity |
|
| Breakup by Region |
|
| Market Dynamics |
|
| Competitive Landscape |
|
| Companies Covered |
|
How To Order
Our step-by-step guide will help you select, purchase, and access your reports swiftly, ensuring you get the information that drives your decisions, right when you need it.

Select License Type
Choose the right license for your needs and access rights.

Click on ‘Buy Now’
Add the report to your cart with one click and proceed to register.

Select Mode of Payment
Choose a payment option for a secure checkout. You will be redirected accordingly.
Pricing Plans


One User
Five Users
Unlimited Users
Connect For More Information
Our expert team of analysts will offer full support and resolve any queries regarding the report, before and after the purchase.
Our expert team of analysts will offer full support and resolve any queries regarding the report, before and after the purchase.
We employ meticulous research methods, blending advanced analytics and expert insights to deliver accurate, actionable industry intelligence, staying ahead of competitors.
Our skilled analysts offer unparalleled competitive advantage with detailed insights on current and emerging markets, ensuring your strategic edge.
We offer an in-depth yet simplified presentation of industry insights and analysis to meet your specific requirements effectively.
Why Choose Us
We ensure that you get unmatchable competitive advantage by providing detailed insights about the existing market scenario as well as the emerging and high growth markets.
Regions and Countries with the Highest Number of Returning Clients
85%
Projects delivered with customization
90%
Projects involving industry specific expertise
24x7
Analysts Support
500+
Corporates choose us as their preferred partner
Commitment to Excellence
Diverse Teams
Innovative Solutions
Client Centric Approach
Continuous Improvement

Subscribe to our Newsletter
By subscribing you agree to with our privacy policy and provide
consent to
receive
updates
from our company.

United States (Head Office)
30 North Gould Street, Sheridan, WY 82801
+1-415-325-5166
Australia
63 Fiona Drive, Tamworth, NSW
+61 448 06 17 27
India
C130 Sector 2 Noida, Uttar Pradesh 201301
+91-120-433-0800
Philippines
40th Floor, PBCom Tower, 6795 Ayala Avenue Cor V.A Rufino St. Makati City,1226.
+63 287899028, +63 967 048 3306
United Kingdom
6 Gardner Place, Becketts Close, Feltham TW14 0BX, Greater London
+44-753-713-2163
Vietnam
193/26/4 St.no.6, Ward Binh Hung Hoa, Binh Tan District, Ho Chi Minh City
+84865399124


