Consumer Insights
Uncover trends and behaviors shaping consumer choices today
Procurement Insights
Optimize your sourcing strategy with key market data
Industry Stats
Stay ahead with the latest trends and market analysis.
The Australia and New Zealand plastic bottles market covers blow-moulded bottles made from polyethylene terephthalate, high-density polyethylene, polypropylene and other resins that hold water, soft drinks, milk, juice, edible oils, personal care products, household cleaners and medicines. Lightweight and shatter-resistant, they cut freight weight against glass and can be recovered through container deposit schemes.
In 2025, the market is valued at AUD 1420.00 million and is forecast to grow at a CAGR of 4.10%, reaching AUD 2122.25 million by 2035. Growth is driven by more than 1.3 million tonnes of annual plastic packaging use in Australia, state container deposit schemes and brand owner shifts to recycled PET and HDPE.
Compound Annual Growth Rate
4.1%
Value in AUD million
2026-2035
The Australia and New Zealand plastic bottles market is at a turning point. Bottles were once judged on weight, clarity and cost, but deposit schemes, recycled content expectations and resin supply shocks now decide which resins, sizes and suppliers win shelf space.
Three forces are shaping the market: state container deposit schemes, led by New South Wales with 15 billion containers returned; local food-grade recycling capacity at Circular Plastics Australia; and a policy debate over mandatory recycled content that governments left open in 2026.
In April 2026, Pact Group reported dairy-grade HDPE resin prices more than doubling after the Middle East conflict, and in September 2026 environment ministers declared packaging reform urgent without committing to mandatory targets or an extended producer responsibility scheme.
The market is moving from lightweight commodity bottles sold on price towards recycled, deposit-ready and supply-secure formats. Polyethylene terephthalate leads because beverage bottles depend on its clarity and barrier, while high-density polyethylene and mid-sized single-serve bottles advance fastest as milk and household brands face recycled content expectations. New Zealand grows quickest, and Australia remains the larger base. Deposit schemes, local food-grade recycling plants and brand owner commitments underpin a durable, multi-year outlook.
| Metric | Value |
| Market Size 2025 | AUD 1420.00 million |
| Projected Market Size 2035 | AUD 2122.25 million |
| CAGR 2026 to 2035 | 4.10% |
| Fastest-Growing Material | High-Density Polyethylene: 4.6% CAGR |
| Fastest-Growing Capacity | 251 to 500 ml: 4.4% CAGR |
| Largest Revenue Segment 2025 | Polyethylene Terephthalate |
| Dominant Country | Australia |
| Highest CAGR by Country | New Zealand: 4.5% |
| Containers returned through Return and Earn in New South Wales | 15 billion containers |
Deposit Schemes and Recycled Content Anchor Demand
Revenue is on course to expand by about 49% across the decade, from AUD 1,420.00 million in 2025 to AUD 2,122.25 million in 2035 at a 4.1% CAGR. Beverage, dairy and household liquids make bottle demand recurring, while state deposit schemes and local recycled resin supply turn recycled content goals into practical feedstock.
High-Density Polyethylene and Mid-Sized Bottles Lead Growth
Polyethylene terephthalate holds the largest revenue share, but high-density polyethylene grows at an estimated 4.6% CAGR and the 251 to 500 ml format at an estimated 4.4% CAGR through 2035. Milk, juice and household bottles face recycled content pressure, while single-serve formats ride returns through deposit schemes.
Pact Group Resin Warning Tests Supply Security
Pact Group told the market in April 2026 that the Middle East conflict had exposed Australia's dependence on imported resin, and it asked for support to source critical resin and for minimum recycled content in packaging.
| Report Summary | Unit | Value |
| Base Year | AUD million | 2025 |
| Historical Period | AUD million | 2019 to 2025 |
| Forecast Period | AUD million | 2026 to 2035 |
| Market Size 2025 | AUD million | 1420.00 |
| Market Size 2035 | AUD million | 2122.25 |
| CAGR 2026 to 2035 | Percentage | 4.10 % |
| CAGR by Material: High-Density Polyethylene | Percentage | 4.6 % |
| CAGR by Capacity: 251 to 500 ml | Percentage | 4.4 % |
| CAGR by End-Use Industry: Dairy | Percentage | 4.7 % |
| CAGR by Country: New Zealand | Percentage | 4.5 % |
| Annual Plastic Packaging Use in Australia | Million Tonnes | 1.3 |
| Average Container Return Rate Across Australian Deposit Schemes | Percentage | 68 |
| Market Share by Country 2025 | Australia | Dominant Share |
Deposit schemes, recycled content expectations and imported resin exposure are changing how bottles are made and collected. Polyethylene terephthalate leads, while high-density polyethylene, mid-sized formats and New Zealand grow quickest.
The Australia and New Zealand plastic bottles market is being reshaped by unsettled national reform, resin supply shocks, higher refund ambitions and fast-growing deposit scheme returns.
September 2026 - Environment Ministers Declare Packaging Reform Urgent Without Mandates
April 2026 - Middle East Conflict Doubles Dairy-Grade HDPE Resin Prices
March 2026 - Campaign Launches to Double the Container Refund to 20 Cents
January 2026 - New South Wales Return and Earn Reaches 15 Billion Containers
Growth is structurally supported rather than cyclical. Deposit schemes supply feedstock, recycled content goals shape design, and imported resin volatility pushes converters towards local recycled material.
Recent developments, presented from the most recent, show the Australia and New Zealand plastic bottles market moving from Pacific feedstock sourcing and recycler results into recycled bottle commitments and leadership change.
September 2026 - Pact Group Chief Executive Sanjay Dayal to Step Down
August 2026 - Asahi Beverages Moves Australian Soft Drink Bottles to Recycled Plastic
August 2026 - Cleanaway Writes Down Circular Plastics Australia Investment
May 2026 - Coca-Cola Europacific Partners Ships Pacific PET to Melbourne Recycler
Recycled PET is moving from pilot to routine supply while recycling plant economics stay fragile. Leadership change at a major converter adds uncertainty to long-term capacity planning.
The Expert Market Research’s report on the Australia And New Zealand Plastic Bottles Market offers a detailed analysis of the market based on the following segments.
Market Breakup by Material
Polyethylene Terephthalate leads because water, soft drink and juice bottles depend on its clarity and gas barrier, and in May 2026 the Albury and Altona North recycling plants were each described as able to process the equivalent of one billion bottles a year. High-Density Polyethylene grows fastest at an estimated 4.6% CAGR through 2035, as milk and household bottles face recycled content pressure and Pact Group reported dairy-grade resin prices doubling in April 2026. Polypropylene serves closures, hot-fill sauces and personal care bottles. Others include polyvinyl chloride, polystyrene and bio-based bottles in niche uses.
Market Breakup by Capacity
1.1 to 3 Litres leads because Australia places about one billion milk and cream bottles on the market each year, according to Pact Group in April 2026, alongside two-litre soft drinks and household liquids. 251 to 500 ml grows fastest at an estimated 4.4% CAGR through 2035, as single-serve water and soft drinks are returned through deposit schemes, and Victoria recorded a weekly record of 34.85 million containers in January 2026. Up to 250 ml covers pharmaceutical, personal care and juice minis, while 501 ml to 1 Litre serves sports water and cordial. Others covers bottles above 3 litres, including cooler and bulk oil formats.
Market Breakup by End-Use Industry
Beverages leads because water, soft drink and juice bottles make up the main flow through deposit schemes, which returned 15 billion containers in New South Wales by January 2026. Dairy grows fastest at an estimated 4.7% CAGR through 2035, because milk bottles carry the most HDPE and the April 2026 resin shock stretched lead times to 105 days. Food and Edible Oils covers sauces and oils, Personal Care and Household covers shampoo and cleaning liquids, and Pharmaceuticals and Healthcare covers syrups and tablets. Others include automotive fluids and agricultural chemicals, where bottle volumes follow farm and workshop demand.
Market Breakup by Region
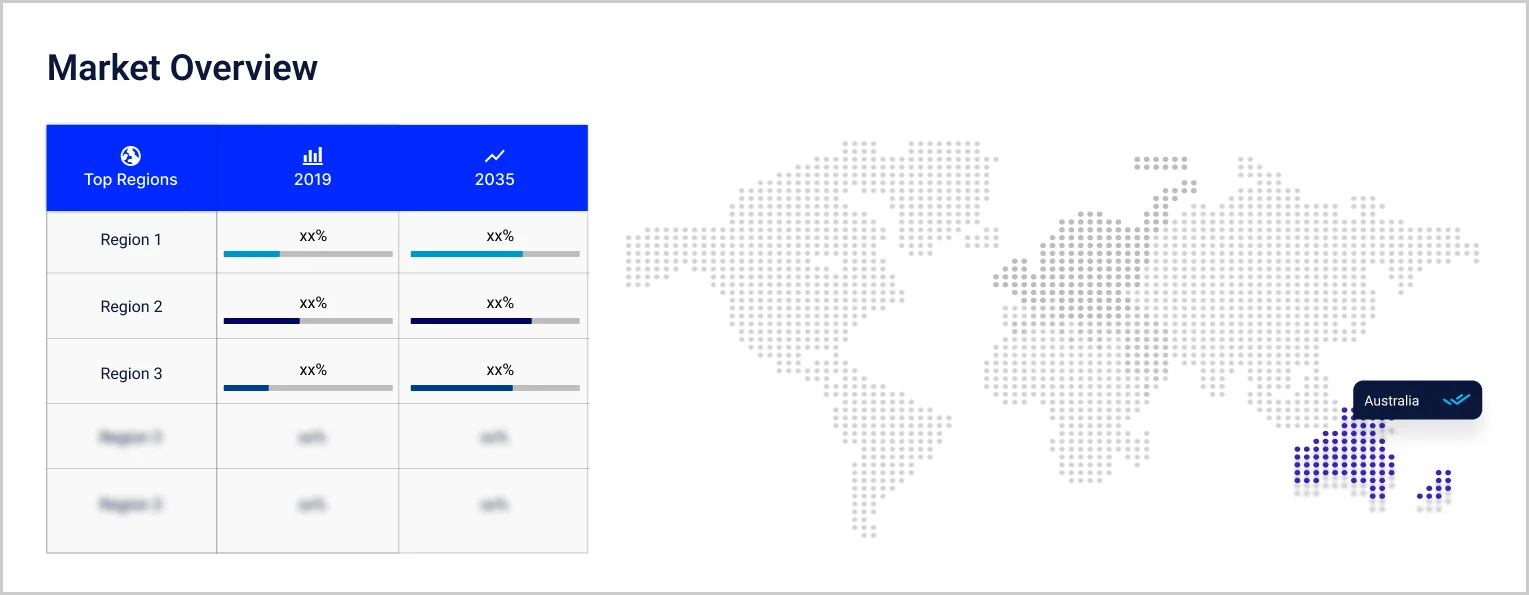
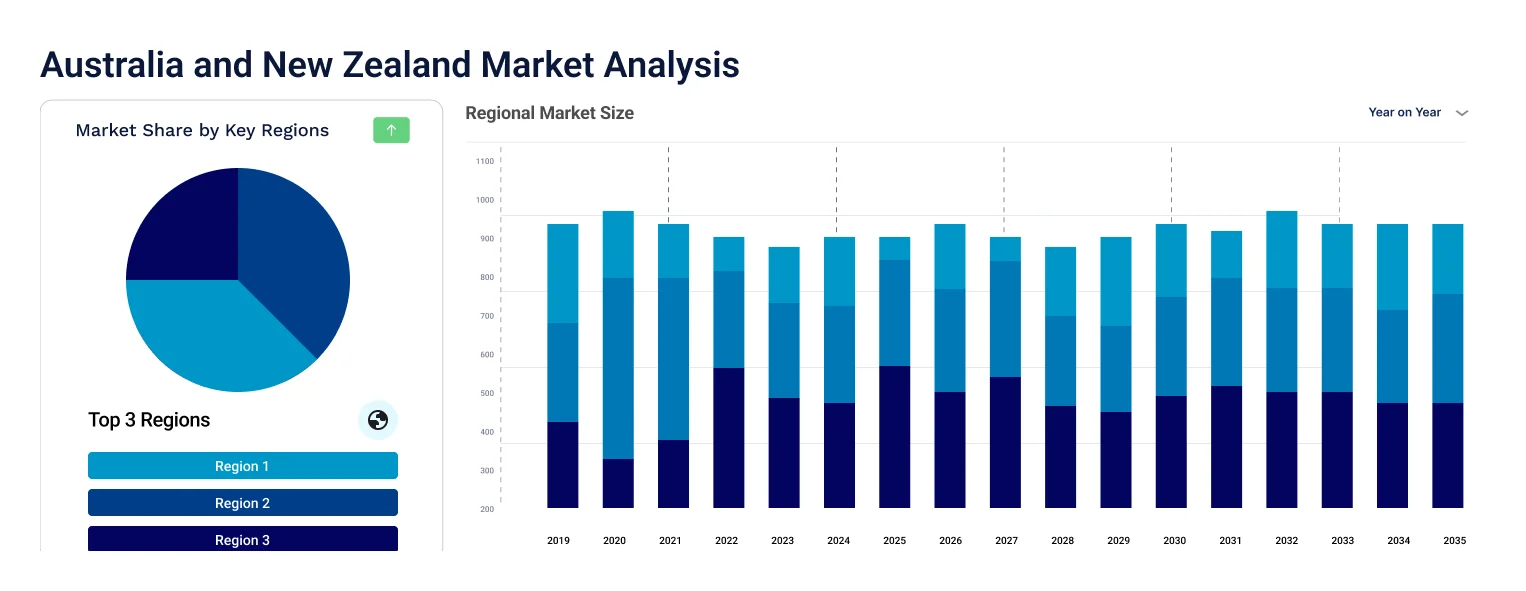
Australia dominates, anchored by more than 1.3 million tonnes of annual plastic packaging use, Return and Earn in New South Wales and 3 billion returns through the Victorian scheme by April 2026, and it grows at an estimated 4.0% CAGR through 2035. New Zealand is the fastest-growing country at an estimated 4.5%, because fewer than half of the 2.6 billion drink containers sold each year are collected, and Pact Recycling NZ turns PET bottles into trays at Wellington. Others covers Pacific Island markets, where Coca-Cola Europacific Partners began shipping PET to Melbourne in May 2026, and grows at an estimated 4.3%.
| CAGR 2026 to 2035, Market by Country | Growth Rate |
| Australia | 4.0 % |
| New Zealand | 4.5 % |
| Others (incl. Pacific Island markets) | 4.3 % |
Competition combines local converters, beverage and dairy brand owners, and recycling joint ventures. Entry barriers include blow-moulding scale, access to imported and recycled resin, food-contact approvals and the long-term filler contracts that anchor multi-year supply.
Pact Group
Pact Group, headquartered in Cremorne, Victoria, was founded in 2002 by Raphael and Fiona Geminder and makes PET and HDPE bottles for milk, juice, water and household products, with recycled resin sourced through Circular Plastics Australia. It told a Senate inquiry in June 2026 that only 16% of its 189,000 tonnes of annual output used recycled plastic. Pact warned of resin shortages in April 2026, and in September 2026 chief executive Sanjay Dayal announced he would step down.
Visy
Visy, headquartered in Melbourne, was founded in 1948 and is a privately held manufacturer and recycler of cardboard, cans, glass and plastics. Its plastics business makes about two billion bottles and preforms a year across nine sites, including 100% rPET bottles and Australia's first 50% recycled milk bottle. In April 2026 it was reported operating the north zone of Victoria's deposit scheme, with more than 230 refund points.
Asahi Beverages
Asahi Beverages, headquartered in Melbourne, traces its lineage to Schweppes and is owned by Asahi Group Holdings, which bought Schweppes Australia through Asahi Breweries in 2009. It makes Schweppes, Solo, Pepsi, Cool Ridge, Frantelle and Cottee's. In August 2026 it said all its Australian soft drink bottles, about 350 million a year, use 100% recycled plastic, and it is a joint venture partner in Circular Plastics Australia.
Coca-Cola Europacific Partners
Coca-Cola Europacific Partners, headquartered in Uxbridge, England, took its current name in May 2021 after acquiring Coca-Cola Amatil, and distributes Coca-Cola brands across Australia and the Pacific. CCEP Australia, led by Orlando Rodriguez, is a partner in Circular Plastics Australia. In May 2026 it received 9.4 tonnes of Vanuatu PET at the Altona North plant, with up to 2,000 tonnes expected over twelve months.
Other players operating in the Australia and New Zealand plastic bottles market include Cleanaway, Circular Plastics Australia, Alto Packaging, Suntory Oceania, and Fonterra, alongside specialist blow-moulders, preform suppliers, closure makers and recycled resin processors supporting beverage, dairy, household and healthcare bottle supply across Australia and New Zealand.
Competition rests on recycled resin access, blow-moulding scale, food-contact approvals and long-term filler contracts rather than price alone. Joint ventures between recyclers, converters and beverage brands increasingly secure supply.


Upto 15% Off
AUD
$2749 $2499
$3849 $3499
$4949 $4499
$6049 $5499


*While we strive to always give you current and accurate information, the numbers depicted on the website are indicative and may differ from the actual numbers in the main report. At Expert Market Research, we aim to bring you the latest insights and trends in the market. Using our analyses and forecasts, stakeholders can understand the market dynamics, navigate challenges, and capitalize on opportunities to make data-driven strategic decisions.*
The Australia and New Zealand plastic bottles market is valued at AUD 1420.00 million in 2025, supported by container deposit schemes, recycled PET and HDPE capacity and beverage and dairy demand, with Australia as the larger base.
The market is forecast to reach AUD 2122.25 million by 2035, growing at a CAGR of 4.10 % over the 2026 to 2035 period, driven by deposit scheme returns, local recycled resin supply and brand owner recycled content commitments.
High-Density Polyethylene records the highest CAGR at an estimated 4.6% through 2035, as milk, juice and household bottles face recycled content pressure and dairy-grade resin supply tightens.
Australia dominates, supported by more than 1.3 million tonnes of annual plastic packaging use and state deposit schemes. New Zealand is the fastest-growing country at an estimated 4.5% CAGR, helped by the growing case for a national container return scheme.
Key players include Pact Group, Visy, Asahi Beverages, Coca-Cola Europacific Partners, Cleanaway, Circular Plastics Australia, Alto Packaging, Suntory Oceania, and Fonterra.
It is a joint venture of Cleanaway, Pact Group, Asahi Beverages and Coca-Cola Europacific Partners that recycles used PET bottles into food-grade resin at plants in Albury, New South Wales, and Altona North, Victoria.
Australian state schemes pay 10 cents per container, returning clean bottles to recyclers, with New South Wales passing 15 billion returns. New Zealand has no scheme, and fewer than half of its 2.6 billion drink containers are collected.
Explore our key highlights of the report and gain a concise overview of key findings, trends, and actionable insights that will empower your strategic decisions.
| REPORT FEATURES | DETAILS |
| Base Year | 2025 |
| Historical Period | 2019-2025 |
| Forecast Period | 2026-2035 |
| Scope of the Report |
Historical and Forecast Trends, Industry Drivers and Constraints, Historical and Forecast Market Analysis by Segment:
|
| Breakup by Material |
|
| Breakup by Capacity |
|
| Breakup by End-Use Industry |
|
| Breakup by Region |
|
| Market Dynamics |
|
| Competitive Landscape |
|
| Companies Covered |
|
Datasheet
AUD 2,749
AUD 2,499
tax inclusive*
Single User License
AUD 3,849
AUD 3,499
tax inclusive*
Five User License
AUD 4,949
AUD 4,499
tax inclusive*
Corporate License
AUD 6,049
AUD 5,499
tax inclusive*
*Please note that the prices mentioned below are starting prices for each bundle type. Kindly contact our team for further details.*
Flash Bundle
Small Business Bundle
Growth Bundle
Enterprise Bundle
*Please note that the prices mentioned below are starting prices for each bundle type. Kindly contact our team for further details.*
Flash Bundle
Number of Reports: 3
20%
tax inclusive*
Small Business Bundle
Number of Reports: 5
25%
tax inclusive*
Growth Bundle
Number of Reports: 8
30%
tax inclusive*
Enterprise Bundle
Number of Reports: 10
35%
tax inclusive*
How To Order

Select License Type
Choose the right license for your needs and access rights.

Click on ‘Buy Now’
Add the report to your cart with one click and proceed to register.

Select Mode of Payment
Choose a payment option for a secure checkout. You will be redirected accordingly.
Strategic Solutions for Informed Decision-Making
Stay upgraded and grab opportunities by strategic insights
Stay informed and aware for a Market Leverage
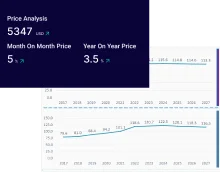
Analyze pricing patterns with comprehensive trend analyses.
Analyse trade data for supply chain insights.
Leverage cost reports for smart savings
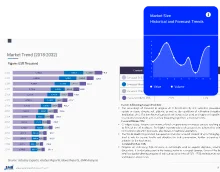
Elevate supply chain with collaboration
Contact Us for Further Information
Our specialized analysts will be available to answer all the pre-purchase and post-purchase queries regarding the report.
Our specialized analysts will be available to answer all the pre-purchase and post-purchase queries regarding the report.
Staying one step ahead of the market landscape with our in-depth research methods, integrating advanced analytics to drive precise and tangible outcomes.
Our expert analyst team offers a significant advantage over competitors, with extensive market insights into the latest trends, putting you strategically ahead.
We deliver a simplified yet extensive report, comprising in-depth industry insights and analytics tailored to your industry requirements.
We are happy to help you navigate through the services we offer and solve your queries.
Contact us