Consumer Insights
Uncover trends and behaviors shaping consumer choices today
Procurement Insights
Optimize your sourcing strategy with key market data
Industry Stats
Stay ahead with the latest trends and market analysis.
The Australia AIOps market covers software and services that apply machine learning and automation to IT operations data, correlating events, detecting anomalies, finding root causes and triggering fixes across applications, networks and infrastructure. It is bought by enterprises and agencies running hybrid environments, as platforms, subscriptions and managed services. Unlike traditional monitoring tools that raise alerts for people to triage, AIOps platforms reduce noise and act on incidents.
In 2025, the market is valued at AUD 739.90 million in 2025 and is forecast to grow at a CAGR of 18.80%, reaching AUD 4143.21 million by 2035. Growth is driven by business AI uptake, with the Australian Bureau of Statistics reporting in June 2026 that 35% of large businesses used AI, the National AI Plan of December 2025, and hybrid estates that generate more telemetry than operations teams can triage.
Compound Annual Growth Rate
18.8%
Value in AUD million
2026-2035
The Australia AIOps market is moving from alert correlation to agentic operations. Banks, insurers and telecommunications groups are consolidating monitoring tools and adding automation that diagnoses incidents, while vendors extend partner channels to reach mid-sized buyers.
Three forces are shaping the market: policy, with the National AI Plan released in December 2025; technology, as Dynatrace introduced Dynatrace Intelligence in January 2026; and adoption, with the Australian Bureau of Statistics reporting in June 2026 that 35% of large businesses used AI.
In September 2025 GMHBA deployed Dynatrace to improve reliability for almost 320,000 members. In February 2026 Macquarie described agentic site reliability engineering with Dynatrace, and in October 2026 Netpoleon ANZ added BMC Helix to its Australian distribution portfolio.
The market is moving from alert noise reduction towards agent-led diagnosis and remediation, as hybrid estates produce more telemetry than teams can read. Cloud deployment leads, since software as a service platforms deploy quickly, while on-premises remains relevant for regulated workloads. Large Enterprises hold the largest share, and Small and Medium Enterprises grow quickest as partners lower entry costs. New South Wales remains the largest region, and the Australia Capital Territory grows quickest. National AI policy and tool consolidation point to durable growth, even as skills shortages, data quality and integration effort remain constraints.
| Metric | Value |
| Market Size 2025 | AUD 739.90 million |
| Projected Market Size 2035 | AUD 4143.21 million |
| CAGR 2026 to 2035 | 18.80% |
| Fastest-Growing Organization Type | Small and Medium Enterprises: 20.8% CAGR |
| Fastest-Growing Deployment Mode | Cloud: 19.7% CAGR |
| Largest Revenue Segment 2025 | Large Enterprises |
| Dominant Region | New South Wales |
| Highest CAGR by Region | Australia Capital Territory: 20.6% |
| Large Australian businesses using AI (ABS, 2024-25) | 35% |
AI Adoption and Policy Anchor Long-Term Demand
Revenue is on course to grow more than fivefold across the decade, from AUD 739.90 million in 2025 to AUD 4,143.21 million in 2035 at an 18.8% CAGR. The National AI Plan of December 2025 and rising business AI use give buyers a clearer case for automating operations.
Cloud and SME Segments Lead Growth
Large Enterprises hold the largest share, but Small and Medium Enterprises grow at an estimated 20.8% CAGR and Cloud at an estimated 19.7% CAGR through 2035. Netpoleon ANZ's October 2026 BMC Helix agreement targets mid-market buyers through partners.
Vendors Compete on Agentic Operations
Dynatrace launched Dynatrace Intelligence in January 2026, BMC Helix added a distributor in October 2026, and ServiceNow sits inside Westpac's ticketing workflow, so competition now turns on automation depth and partner reach.
| Report Summary | Unit | Value |
| Base Year | AUD million | 2025 |
| Historical Period | AUD million | 2019 to 2025 |
| Forecast Period | AUD million | 2026 to 2035 |
| Market Size 2025 | AUD million | 739.90 |
| Market Size 2035 | AUD million | 4143.21 |
| CAGR 2026 to 2035 | Percentage | 18.80 % |
| CAGR by Organization Type: Small and Medium Enterprises | Percentage | 20.8 % |
| CAGR by Deployment Mode: Cloud | Percentage | 19.7 % |
| CAGR by Region: Australia Capital Territory | Percentage | 20.6 % |
| CAGR by Region: Western Australia | Percentage | 19.4 % |
| Large Businesses Using AI | Percentage | 35 |
| Medium Businesses Using AI | Percentage | 22 |
| Market Share by Region 2025 | New South Wales | Dominant Share |
Demand reflects a structural shift as business AI use rises and IT estates grow too complex for manual triage. Cloud deployment leads and grows fastest, Large Enterprises hold the largest share, and Small and Medium Enterprises grow quickest. New South Wales is the largest region and the Australia Capital Territory grows fastest. Growth is underpinned by dated policy, vendor launches and named bank deployments rather than speculative forecasts.
The Australia AIOps market is being shaped by rising business AI use, agentic operations platforms, national AI policy and consolidation of observability tools across retail and other sectors.
June 2026 - Business AI Use Rises Fastest Among Large and Medium Enterprises
January 2026 - Agentic Operations Platforms Move AIOps From Alerts to Action
December 2025 - National AI Plan Gives Buyers a Clearer Framework for Production AI
November 2025 - Retailers Consolidate Observability Tools as AI Drives Investment
Rising business AI use, agentic platforms, national AI policy and tool consolidation show demand is structural rather than cyclical. Policy sets the framework, adoption adds workloads that need monitoring, and vendors compete on automation. AIOps is becoming core infrastructure for Australian enterprises.
Recent developments, presented from the most recent, show a distribution agreement for BMC Helix, bank deployments of automation and agents, and an insurer's adoption of observability.
October 2026 - Netpoleon ANZ Adds BMC Helix to Its Regional Distribution Portfolio
June 2026 - Westpac Details Event-Driven Automation and AIOps in IT Operations
February 2026 - Macquarie Brings Agentic Site Reliability Engineering to Its Digital Bank
September 2025 - GMHBA Deploys Dynatrace to Improve Digital Reliability
From GMHBA's September 2025 deployment to Netpoleon ANZ's October 2026 agreement, buyers gained more automation and wider channels. Macquarie's February 2026 results and Westpac's June 2026 workflow show banks moving from monitoring to action. The momentum validates sustained commercial demand for operations automation.
The Expert Market Research’s report on the Australia AIOps Market offers a detailed analysis of the market based on the following segments.
Market Breakup by Organization Type
Large Enterprises lead, in our estimate, because complex hybrid estates justify platform spend, and the Australian Bureau of Statistics reported in June 2026 that 35% of large businesses used AI, as seen in Macquarie's February 2026 agentic reliability programme. Small and Medium Enterprises grow fastest at an estimated 20.8% CAGR through 2035, as partner channels such as Netpoleon ANZ's October 2026 BMC Helix agreement reach mid-sized buyers, and 22% of medium businesses used AI against about 11% of small and micro businesses.
Market Breakup by Deployment Mode
Cloud leads, in our estimate, because platforms delivered as software are quick to deploy, and grows fastest at an estimated 19.7% CAGR through 2035, with BMC Helix operating as an independent software as a service company since 2025 and Dynatrace Intelligence launched in January 2026. On-premises remains relevant for regulated estates, as Westpac in June 2026 sent health-check data to AI models on its own platform, and Broadcom's November 2025 expansion of its VMware Cloud Foundation ecosystem for private cloud AI workloads shows demand for controlled environments.
Market Breakup by End Use
IT and Telecom leads, in our estimate, as Telstra InfraCo reported in May 2025 that AI cut reactive power truck rolls by 10% across about 25,000 a year. Media and Entertainment gains from the 38% AI adoption the Australian Bureau of Statistics reported in June 2026 for information, media and telecommunications. BFSI deploys at scale, with Macquarie in February 2026 and Westpac in June 2026. Retail consolidates tools, as a survey in November 2025 showed. Healthcare gains from payers such as GMHBA in September 2025, and Others covers government, energy and education.
Market Breakup by Region
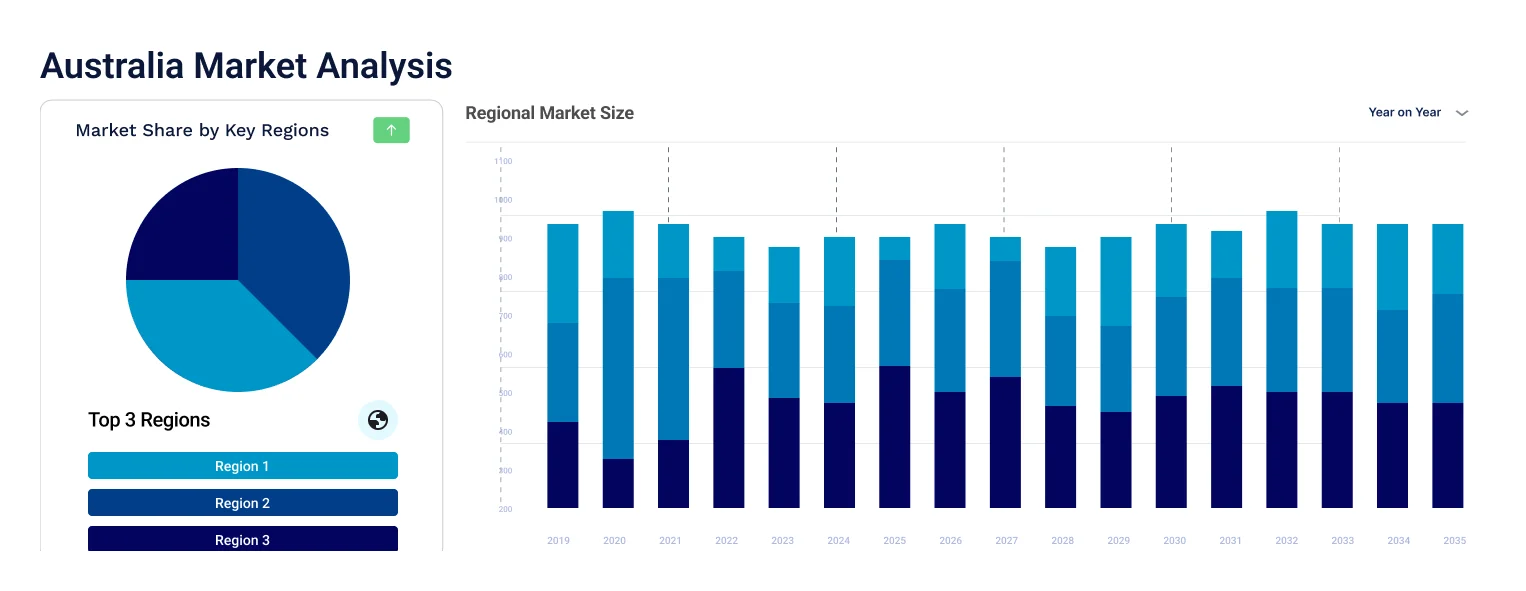
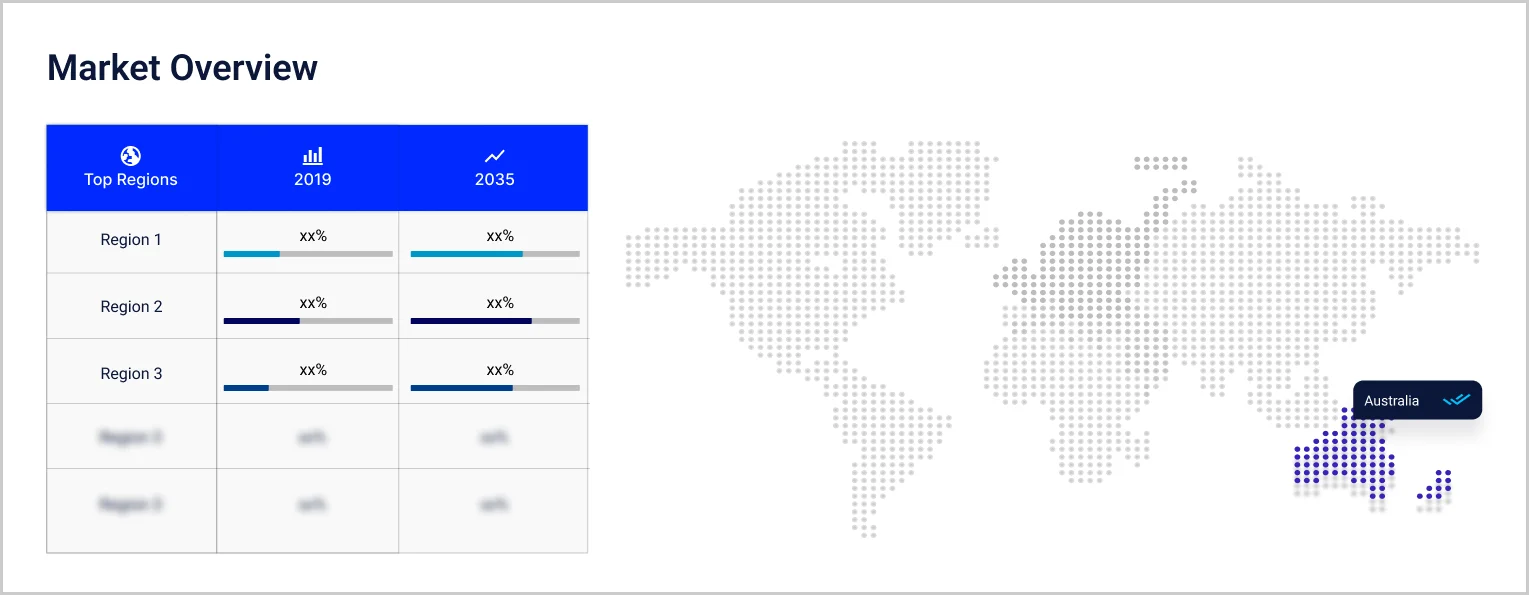
New South Wales dominates, in our estimate, with the largest base of large enterprises, and grows at an estimated 18.9% CAGR through 2035. The Australia Capital Territory held a 2.2% share in 2025 and grows fastest at 20.6%, helped by the National AI Plan of December 2025 and its AI Safety Institute. Western Australia grows at 19.4%, Victoria at 18.2% and Queensland at 18.8%, while Rest of Australia grows at 18.4%, covering South Australia, Tasmania and the Northern Territory.
| CAGR 2026 to 2035, Market by Region | Growth Rate |
| New South Wales | 18.9 % |
| Victoria | 18.2 % |
| Queensland | 18.8 % |
| Australia Capital Territory | 20.6 % |
| Western Australia | 19.4 % |
| Others (Rest of Australia) | 18.4 % |
Competition combines observability specialists, enterprise software groups, service management platforms, infrastructure vendors and global IT services firms. Entry barriers include data integration depth, machine learning accuracy, local data residency, partner channels and the trust of operations teams.
BMC Software, Inc.
BMC Software, Inc. is headquartered in Houston, Texas, United States, and was founded in 1980. It is owned by KKR, and in 2025 its Helix business became an independent company, BMC Helix, focused on IT service and operations. The portfolio spans mainframe optimisation, automation and, through BMC Helix, ServiceOps and AIOps software. In October 2026 Netpoleon ANZ signed an agreement to distribute BMC Helix ServiceOps and AIOps across Australia and New Zealand. Its differentiators are service management heritage and agentic AI in one platform.
Broadcom, Inc.
Broadcom, Inc. is headquartered in Palo Alto, California, United States, and traces its origins to a Hewlett-Packard semiconductor division formed in 1961. After completing its purchase of VMware, it added private cloud software to its semiconductor and infrastructure software portfolio. In November 2025 it expanded the VMware Cloud Foundation ecosystem with AI ReadyNodes certified for AI training and inference workloads. Its differentiators are control of private cloud infrastructure software and a broad hardware partner ecosystem.
Dynatrace Asia Pacific Pty. Ltd.
Dynatrace Asia Pacific Pty. Ltd. is the regional arm of Dynatrace, a United States observability software company founded in 2005 and based in Massachusetts. Its platform combines observability, causal AI and automation for applications and infrastructure. On 28 January 2026 Dynatrace introduced Dynatrace Intelligence, in February 2026 Macquarie described using Dynatrace SRE agents in its digital bank, and GMHBA deployed the platform in September 2025. Its differentiators are causal topology data and explainable, agent-led operations.
HCL Technologies Ltd.
HCL Technologies Ltd., known as HCLTech, is headquartered in Noida, India, traces its origins to 1976 and has more than 223,000 employees across 60 countries. It entered Australia in 1999 with a Sydney office and now has over 2,400 employees across six cities, serving banks, retailers, utilities and government. In December 2025 it announced a partnership with the University of Western Australia, and its Sydney office hosts an AI customer experience centre. Its differentiators are managed services scale and long-standing client relationships.
Other players operating in the Australia AIOps market include IBM Corporation, Open Text Corporation, Moogsoft Inc., Nutanix, Inc., and ServiceNow, Inc., alongside regional and niche suppliers offering monitoring, observability and automation software across Australia.
Competition turns on automation depth, data integration and channel reach rather than alert volume alone. Dynatrace pairs causal data with agents, BMC Helix extends through Netpoleon ANZ, and Broadcom builds on private cloud infrastructure. HCLTech adds services scale, while ServiceNow tickets sit at the centre of workflows such as Westpac's June 2026 automation.


Upto 15% Off
AUD
$2749 $2499
$3849 $3499
$4949 $4499
$6049 $5499


*While we strive to always give you current and accurate information, the numbers depicted on the website are indicative and may differ from the actual numbers in the main report. At Expert Market Research, we aim to bring you the latest insights and trends in the market. Using our analyses and forecasts, stakeholders can understand the market dynamics, navigate challenges, and capitalize on opportunities to make data-driven strategic decisions.*
The Australia AIOps market is valued at AUD 739.90 million in 2025, supported by rising business AI use, cloud adoption and agentic operations platforms, with New South Wales as the largest region.
The market is forecast to reach AUD 4143.21 million by 2035, growing at a CAGR of 18.80 % over the 2026 to 2035 period, driven by national AI policy, hybrid estate complexity and demand for automated incident diagnosis.
Small and Medium Enterprises record the highest CAGR at an estimated 20.8% through 2035, as partner channels and software as a service lower entry costs, while Cloud leads deployment modes at an estimated 19.7%.
New South Wales dominates, as it has the largest base of large enterprises, and grows at an estimated 18.9% CAGR. The Australia Capital Territory is the fastest-growing region at an estimated 20.6%, followed by Western Australia at 19.4%.
Key players include BMC Software, Inc., Broadcom, Inc., Dynatrace Asia Pacific Pty. Ltd., HCL Technologies Ltd., IBM Corporation, Open Text Corporation, Moogsoft Inc., Nutanix, Inc., ServiceNow, Inc.
The Australian Bureau of Statistics reported in June 2026 that about 12% of businesses used AI, including 35% of large and 22% of medium businesses. Information, media and telecommunications led industries at 38%.
Macquarie's banking division said in February 2026 that SRE AI agents contributed to 79% faster detection and 59% fewer critical incidents, while Westpac described event-driven automation with AI advice on tickets in June 2026.
Explore our key highlights of the report and gain a concise overview of key findings, trends, and actionable insights that will empower your strategic decisions.
| Report Features | Details |
| Base Year | 2025 |
| Historical Period | 2019-2025 |
| Forecast Period | 2026-2035 |
| Scope of the Report |
Historical and Forecast Trends, Industry Drivers and Constraints, Historical and Forecast Market Analysis by Segment:
|
| Breakup by Organization Type |
|
| Breakup by Deployment Mode |
|
| Breakup by End Use |
|
| Breakup by Region |
|
| Market Dynamics |
|
| Competitive Landscape |
|
| Companies Covered |
|
Datasheet
AUD 2,749
AUD 2,499
tax inclusive*
Single User License
AUD 3,849
AUD 3,499
tax inclusive*
Five User License
AUD 4,949
AUD 4,499
tax inclusive*
Corporate License
AUD 6,049
AUD 5,499
tax inclusive*
*Please note that the prices mentioned below are starting prices for each bundle type. Kindly contact our team for further details.*
Flash Bundle
Small Business Bundle
Growth Bundle
Enterprise Bundle
*Please note that the prices mentioned below are starting prices for each bundle type. Kindly contact our team for further details.*
Flash Bundle
Number of Reports: 3
20%
tax inclusive*
Small Business Bundle
Number of Reports: 5
25%
tax inclusive*
Growth Bundle
Number of Reports: 8
30%
tax inclusive*
Enterprise Bundle
Number of Reports: 10
35%
tax inclusive*
How To Order

Select License Type
Choose the right license for your needs and access rights.

Click on ‘Buy Now’
Add the report to your cart with one click and proceed to register.

Select Mode of Payment
Choose a payment option for a secure checkout. You will be redirected accordingly.
Strategic Solutions for Informed Decision-Making
Stay upgraded and grab opportunities by strategic insights
Stay informed and aware for a Market Leverage
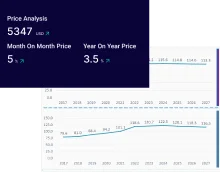
Analyze pricing patterns with comprehensive trend analyses.
Analyse trade data for supply chain insights.
Leverage cost reports for smart savings
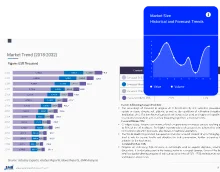
Elevate supply chain with collaboration
Contact Us for Further Information
Our specialized analysts will be available to answer all the pre-purchase and post-purchase queries regarding the report.
Our specialized analysts will be available to answer all the pre-purchase and post-purchase queries regarding the report.
Staying one step ahead of the market landscape with our in-depth research methods, integrating advanced analytics to drive precise and tangible outcomes.
Our expert analyst team offers a significant advantage over competitors, with extensive market insights into the latest trends, putting you strategically ahead.
We deliver a simplified yet extensive report, comprising in-depth industry insights and analytics tailored to your industry requirements.
We are happy to help you navigate through the services we offer and solve your queries.
Contact us